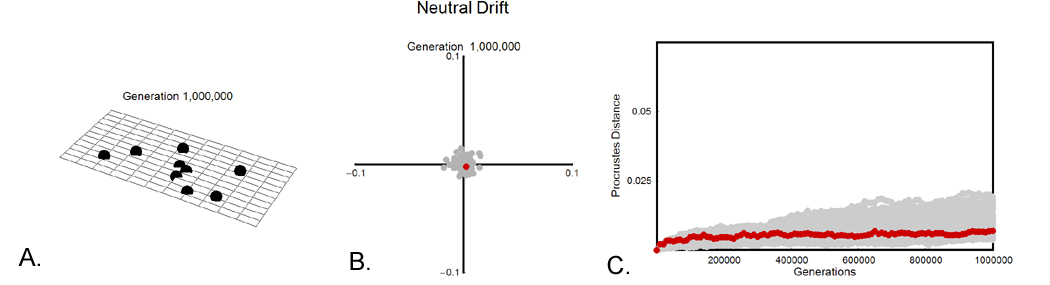
Figure 13. The results of genetic drift when Ne = 70. A. The final phenotype of one of the 100 runs after 1,000,000 generations. Only a slight difference is visually detectable between this and the starting shape. B. Distribution of all 100 phenotypes on the first two principal components after 1,000,000 generations. Note that the scale of the axes is one order of magnitude smaller than in Simulation 1. The red dot indicates the position of the phenotype illustrated in A. Only the first two components are illustrated, but the results in panels A and C are based on all 15 axes. C. The distribution of Procrustes distances in respect to generation. D. Animation of the entire simulation. The period of time covered by this simulation is 1,000,000 generations, which in shrews is equivalent to 800,000 – 1,000,000 years, approximately half the duration of the Pleistocene.