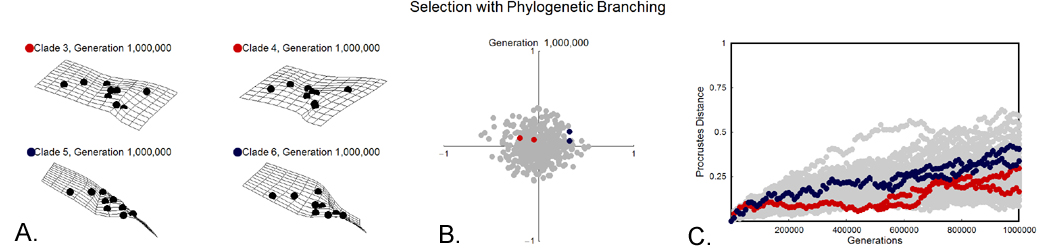
Figure 15. The results of randomly fluctuating selection with a branching phylogeny. A. The phenotypes of the four terminal populations of one of the runs. Note the derived similarities shared by the two members of each clade. B. Position of all 400 phenotypes (100 runs times 4 terminal clades) in the first two PCs of the simulation space. Clade 3 plus 4 are shown by red dots and 5 plus 6 by blue. Note that the positions of the two members of each clade are relatively close to one another. Only the first two components are illustrated, but the results in panels A and C are based on all 15 axes. C. Divergence of all phenotypes from the starting shape. The red trace shows clade 1 plus 3 plus 4 and the blue trace clade 2 plus 5 plus 6. Note this graph does not show the Procrustes distances among the clades, only between each descendant phenotype and the ancestral one. D. Animation of the entire simulation. The period covered by the simulation is 1,000,000 generations, which in shrews is equivalent to 800,000 – 1,000,000 years, or approximately half the duration of the Pleistocene.