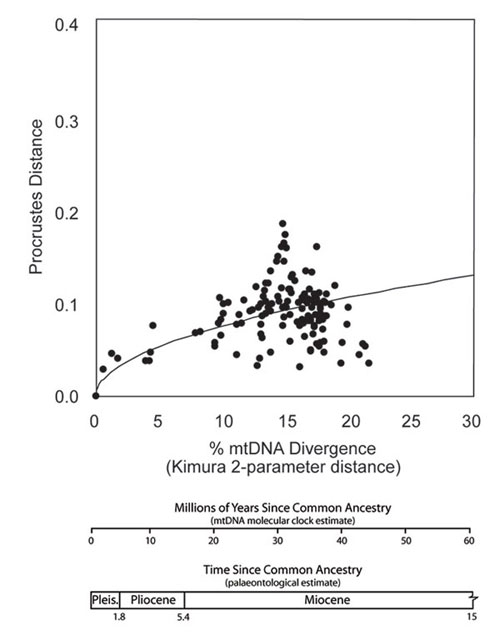
Figure 17. Morphological divergence in molar shape relative to phylogenetic divergence in extant shrews. Each point is a pairwise comparison between two taxa showing the morphological distance between their tooth shapes as Procrustes distance, and the phylogenetic distance between the two as measured by cytochrome b mtDNA. Two alternate timescales are provided for the x-axis: (1) millions of years since common ancestry as estimated using a mtDNA divergence rate of 2% per millions of years, and (2) period of common ancestry as estimated from palaeontological data. The pattern of morphological divergence corresponds to an evolutionary mode of randomly fluctuating selection (c.f., Figure 16). (Figure reproduced from Polly 2003a).