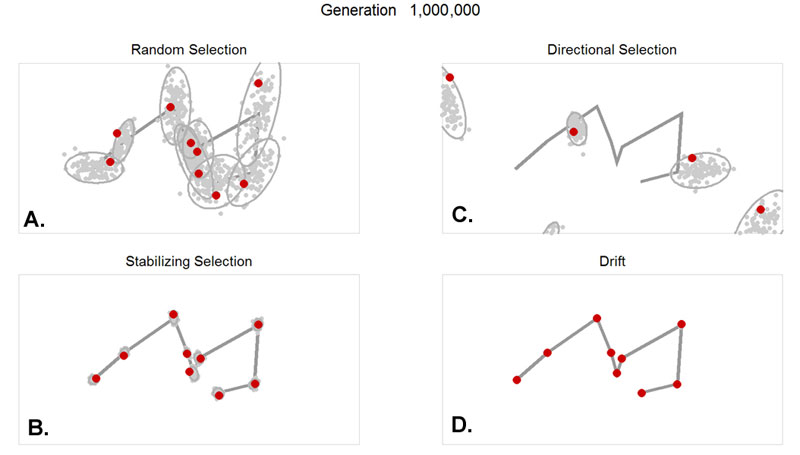
Figure 18. Simulations in phenotypic space. Each panel shows 100 phenotypes, each as nine landmarks, at the end of 1,000,000 simulation generations. Around each landmark is a 95% confidence ellipse, whose orientation helps show the pattern of covariances between landmarks. The ancestral phenotype is shown as a grey line. A. Phenotypes undergoing randomly fluctuating simulation. B. Phenotypes undergoing stabilizing selection. C. Phenotypes undergoing directional selection. D. Phenotypes undergoing drift (Ne = 70). E. Animation of the complete simulation.