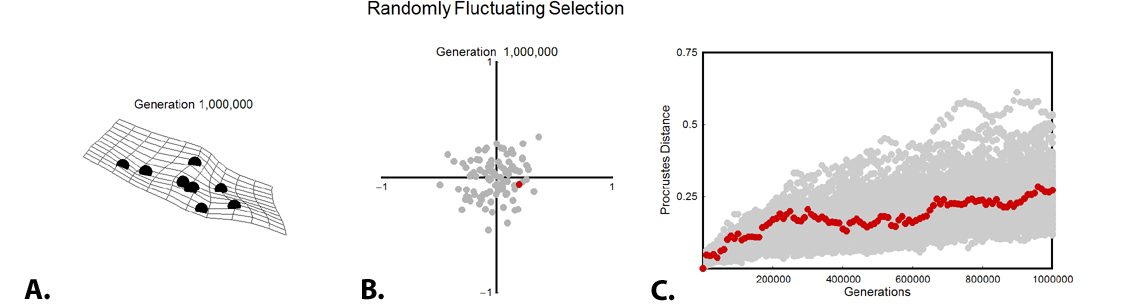
Figure 5. The results of randomly fluctuating selection. A. The end shape of one of the 100 runs as landmarks and a deformation grid. B. The positions of the 100 end shapes on the first two axes of the principal components space. The red dot is the position of the shape shown at left. Only the first two components are illustrated, but the results in panels A and C are based on all 15 axes. C. Divergence from the starting morphology of all 100 runs in Procrustes units. The red trace shows divergence in the morphology pictured in the left panel. D. Animation of the entire simulation sampled every 10,000 generations. The period of time covered by this simulation is 1,000,000 generations, which in shrews is equivalent to 800,000 – 1,000,000 years, approximately half the duration of the Pleistocene.