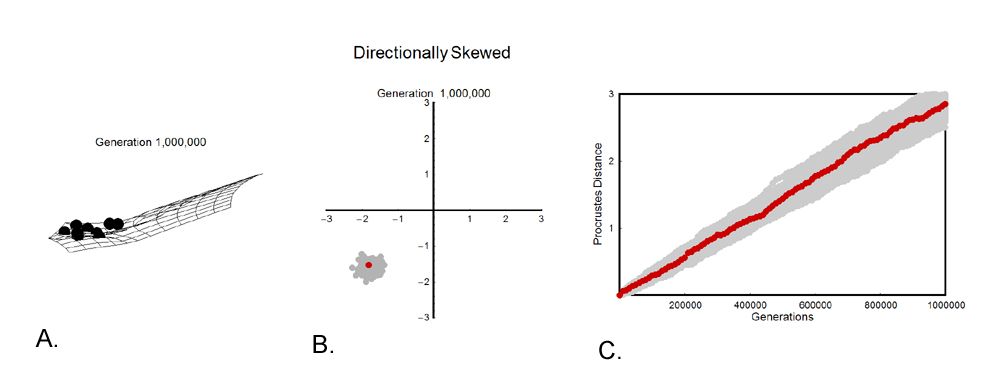
Figure 7. Results of directional selection. A. The final phenotype of one of the 100 runs. B. The final distribution of all 100 runs in the first two PCs. Note that all have moved in a negative direction along both axes. The red dot indicates the position of the phenotype shown in panel A. Only the first two components are illustrated, but the results in panels A and C are based on all 15 axes. C. Distribution of Procrustes distances in relation to time. The red trace indicates the distances of the phenotype shown in A. D. Animation of the full simulation in 10,000 generation intervals. The period of time covered by this simulation is 1,000,000 generations, which in shrews is equivalent to 800,000 – 1,000,000 years, approximately half the duration of the Pleistocene.