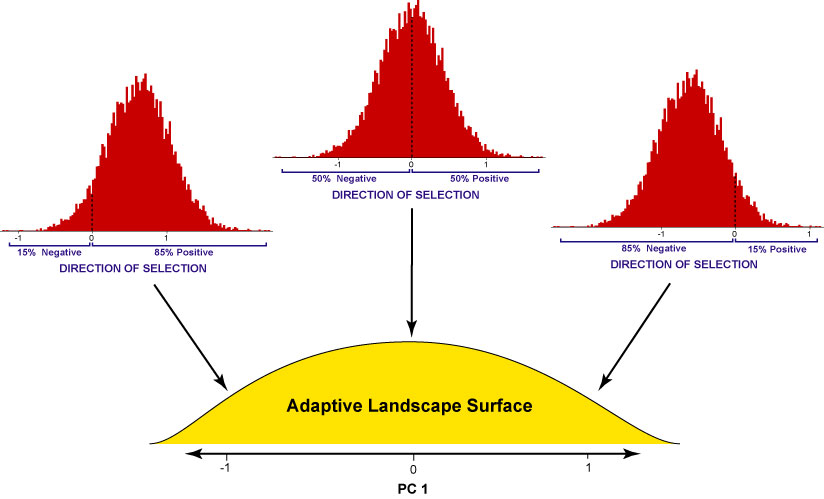
Figure 8. The adaptive landscape surface and distributions of selection coefficients used to simulate stabilizing selection. The height of the yellow surface indicates the relative fitness of the phenotype in variation space. The starting shape, which is located at the centre of the peak, is the most fit. At the peak, the distribution of coefficients has an equal proportion of positive and negative values. As the phenotype moves off the peak to the negative side, the distribution of coefficients has a greater proportion that are positive; when the phenotype moves in a positive direction, the coefficients become proportionally more negative.