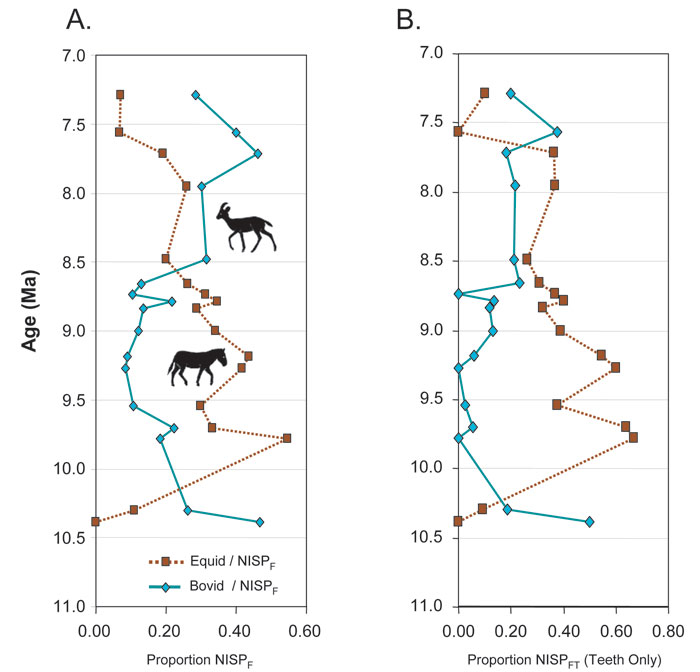
Figure 11. A. Plot of proportion of bovid versus equid specimens through time, based on the sample of all skeletal parts identifiable to mammal family at each survey level. Equids are dominant from soon after their FAD at about 10.3 Ma until about 8.6 Ma, when bovids become more numerous. B. Proportions of equids versus bovids through time, based on teeth only; differences from A likely reflect a taphonomic bias favoring the preservation and discovery of equid teeth, which generally are larger and more robust than bovid teeth. Data from Table 5.