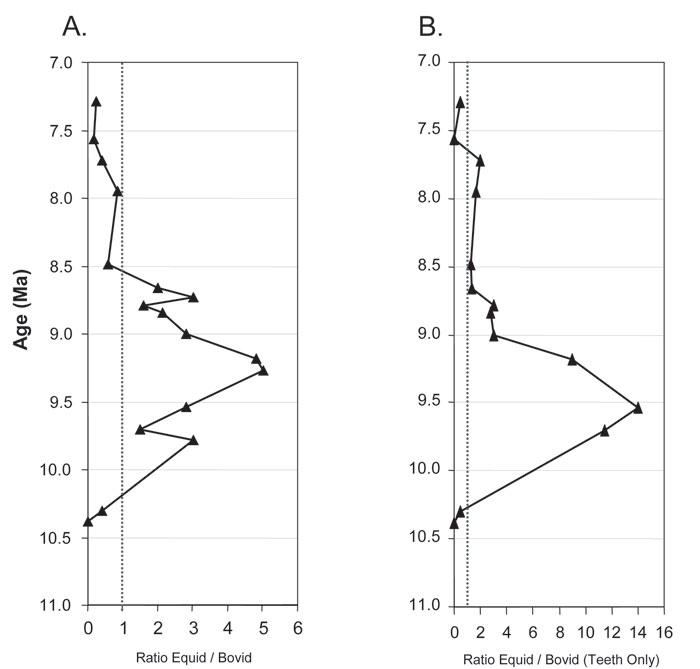
Figure 12. A. Equid to bovid ratio, based on all specimens identifiable to these two groups (Table 5A), showing a peak for equids between 9.5 and 9.0 Ma. Dotted line indicates a 1:1 ratio. B. Equid to bovid ratio, based on teeth only (Table 5B), with some intervals missing due to absence of bovids (denominator = 0).