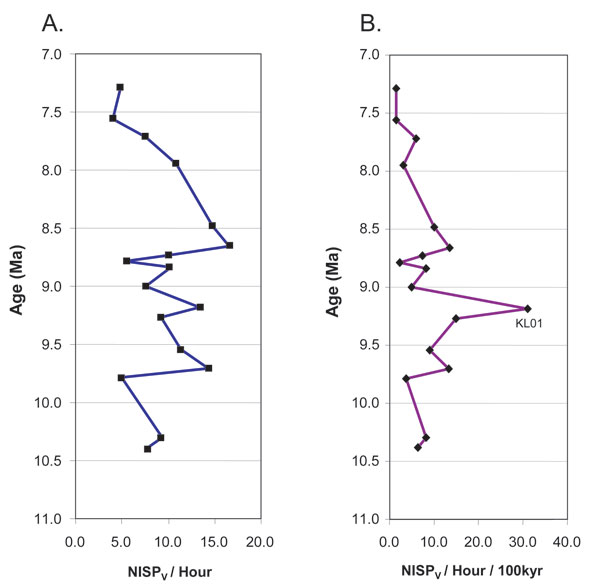
Figure 6. A. Plot of average number of vertebrate remains per search hour that are identifiable at least to major taxon and/or body part, relative to the median age of successive biostratigraphic surveys. This shows variation in the fossil productivity (Pf = NISPv/hour) through time, from the upper part of the Nagri Fm. through part of the Dhok Pathan Fm. B. Data from A divided by the duration of the interval sampled for the biostratigraphic survey, which provides a measure of average productivity per hundred thousand years. The peak at about 9.2 Ma is survey KL01, which is a buff sandstone dipslope and overlying finer-grained deposits above the ‘U’ sandstone level. This level also includes a large number of productive localities and many Sivapithecus specimens. Data in Table 1.