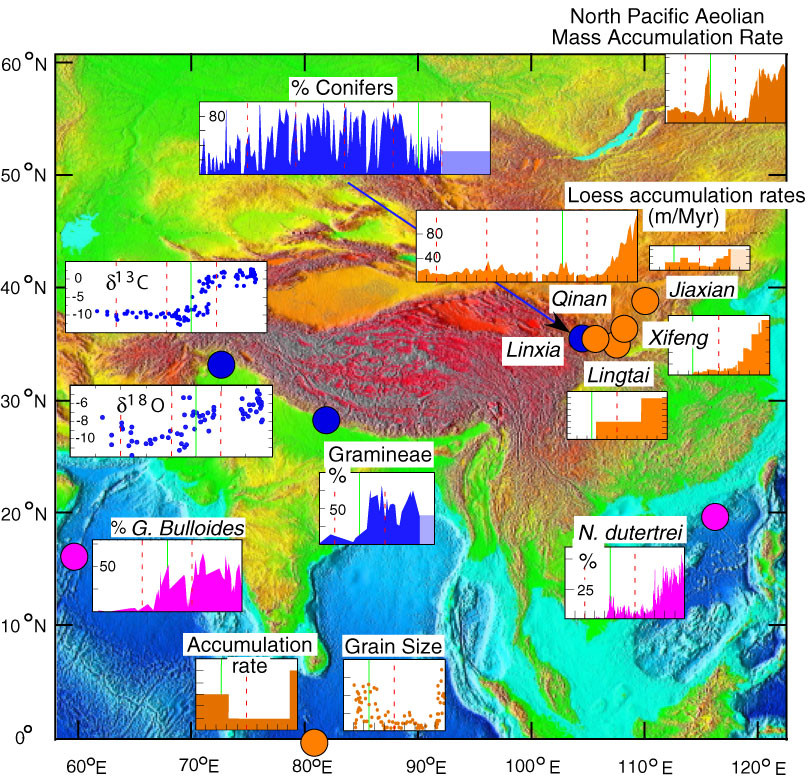
Figure 1. Map of eastern Asia showing time series of environmental changes. In
all plots, time increases from the past on the left to present day on the right;
red lines show 5-Myr intervals, the green line shows 7.5 Ma, and light shading
for young parts of some plots show periods for which there are no data (no sediment,
in most cases). Blue symbols indicate measurements of carbon (![]() 13C)
and oxygen (
13C)
and oxygen (![]() 18O)
isotopes from pedogenic carbonates in Pakistan (Quade and Cerling 1995;
Quade et
al. 1989, 1992,
1995), percentages of grass (Gramineae) pollen from the Siwalik
sediment of Nepal (Hoorn et al. 2000), and percentages of conifer pollen from
the Linxia Basin, Gansu Province, China (Ma et al. 1998). Magenta shows
proportions of microorganisms in
Ocean Drilling Project cores: percentages of Globigerina bulloides in the
Arabian Sea (Kroon et al. 1991) and of Neogloboquadrina dutertrei
in the South China Sea (Wang et al. 2003b). Orange indicates loess accumulation
and terrigenous sediment at the southern edge of the Bengal Fan, both the
accumulation rate, with tick marks at intervals of 50 m/Myr, and mean grain
sizes, with tic marks at 200-µm intervals (France-Lanord et al. 1993).
Loess accumulation rates, plotted at the same scale, are shown for four regions: Qinan (Guo et al. 2002), Lingtai (Ding et al. 1999), Xifeng (Sun et al.
1998a, 1998b), and Jiaxian (Qiang et al. 2001, who did not sample the top 3 Ma).
Finally, aeolian deposition in the North Pacific (Rea et al. 1998) is plotted
with tick marks at 0.2 kg/m2/kyr.
18O)
isotopes from pedogenic carbonates in Pakistan (Quade and Cerling 1995;
Quade et
al. 1989, 1992,
1995), percentages of grass (Gramineae) pollen from the Siwalik
sediment of Nepal (Hoorn et al. 2000), and percentages of conifer pollen from
the Linxia Basin, Gansu Province, China (Ma et al. 1998). Magenta shows
proportions of microorganisms in
Ocean Drilling Project cores: percentages of Globigerina bulloides in the
Arabian Sea (Kroon et al. 1991) and of Neogloboquadrina dutertrei
in the South China Sea (Wang et al. 2003b). Orange indicates loess accumulation
and terrigenous sediment at the southern edge of the Bengal Fan, both the
accumulation rate, with tick marks at intervals of 50 m/Myr, and mean grain
sizes, with tic marks at 200-µm intervals (France-Lanord et al. 1993).
Loess accumulation rates, plotted at the same scale, are shown for four regions: Qinan (Guo et al. 2002), Lingtai (Ding et al. 1999), Xifeng (Sun et al.
1998a, 1998b), and Jiaxian (Qiang et al. 2001, who did not sample the top 3 Ma).
Finally, aeolian deposition in the North Pacific (Rea et al. 1998) is plotted
with tick marks at 0.2 kg/m2/kyr.