RESULTS
Bivalve paleocommunity composition
The number of counted bivalve specimens was similar for both samples with 501 individuals in Sample 52500-1C and 511 in Sample 060700-2A. Paleocommunity differences are often assessed either with presence/absence data or with census data. We have compared our two samples using these two different metrics, and the results indicate that census data conclusions differ from those obtained from presence/absence data alone. Since not all groups were identified in this initial study and since substantive taxonomic revisions need to be undertaken for the groups, we report initial comparisons for some bivalve groups here only to provide evidence for major paleocommunity differences between these two samples.
Arcids made up 19.2% of the bivalve individuals in Sample 52500-1C and 12.7% of Sample 060700-2A bivalves. There are five different arcid species present in Sample 52500-1C and nine different species in Sample 060700-2A. One of those species is Scapharca hispaniolana, and it shows marked differences of abundance between the two samples. In Sample 52500-1C, S. hispaniolana comprised 18.4% of all bivalves counted and 95.8% of all the arcids whereas in Sample 060700-2A, it comprised only 0.6% of all bivalves and 4.6% of the arcids. Another arcid species, Scapharca cibaoica, is not found at all in Sample 52500-1C but comprised 4.7% of bivalves and 36.9% of arcids in Sample 060700-2A.
In another example, pectinids are only 10.4% of Sample 52500-1C but make up 61.8% of Sample 060700-2A. But this significant difference between samples is not reflected in the number of species present: Sample 52500-1C has eight different pectinid species while the other sample has nine. They have seven species in common. "Pecten" thompsoni is one of those species but its abundance varies greatly between samples. In Sample 52500-1C, "P." thompsoni comprised 59.6% of pectinid individuals and only 6.2% of all bivalves. However in Sample 060700-2A, this species was 90% of pectinids and 50.7% of bivalves.
Morphology
Given the disparity in paleocommunity numerical composition between the two samples, the morphological results can be used to determine if paleoecological changes are correlated with phenotypic differences.
"Pecten" thompsoni was selected because of its contrasting abundance in one of the samples and its relatively smaller role in the other assemblage. This taxon is also easy to recognize due to the distinctive protuberances near its byssal notch.
 The distinctive nature of the species eliminates any errors, which may occur due to taxonomic misidentifications. In addition, valves of "P." thompsoni are not highly convex and allow for digital image capture using a flatbed scanner for larger individuals rather than on a conventional microscope-digital camera setup. This combination of factors makes it an ideal candidate for morphometric work.
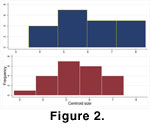
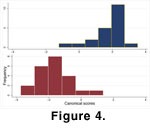
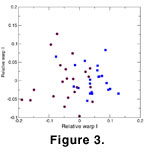 Centroid size does not differ statistically between the two samples (t-test, p = 0.2283), although the variance is slightly greater in Sample 060700-2A (but not statistically significant, F-test, p = 0.2765) (Figure 2). Relative warps analysis of the two samples does, however, indicate differences in shape (Figure 3), though there is considerable overlap. Multivariate analysis of variance and subsequent CVA of partial warp scores confirms that the samples differ significantly in shape (Wilks' Lambda , p < 0.0001) (Figure 4), with 97.7% of specimens correctly identified by the discriminant function.
 Allometric development was measured for each sample by examining the correlation between centroid size and relative warp factors, revealing that there is an allometric relationship apparent in one population but not in the other. In Sample 060700-2A, there is no shape change through the different size classes. Correlations between relative warps I, II, and IV are not significant (Figure 5A; linear regression of relative warp I on centroid size, F-ratio, p = 0.4811). A significant relationship between relative warp III and size (Pearson's correlation coefficient = -0.4563, p = 0.0376) is the spurious result of a single outlying specimen and is not considered further.
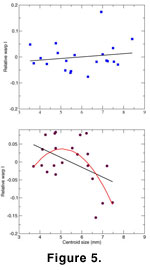 The first relative warp of Sample 052500-1C displays significant allometry (Pearson's correlation coefficient = -0.4676, p = 0.0282), but a plot of this warp and centroid size (Figure 5B) shows very clearly that the relationship between size and shape is not linear. There is an obvious change in the relationship when specimens attain a centroid size of approximately 5.5 mm. A regular (first order) linear regression of relative warp I on size, while statistically significant (F-ratio, p = 0.0282), produces highly irregular residuals. A better regression relationship is found with a second order polynomial regression (F-ratio, p = 0.0069), which produces normally distributed residuals.
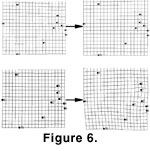 An examination of specimens from Sample 052500-1C suggests that the allometric development is due mainly to a widening of the byssal notch and a change in the shape of the anterior auricle. This change is confirmed by thin-plate spline visualization of the allometry, which was done by constructing splines of predicted specimen shapes, on relative warp I, at two centroid sizes, 4 and 7 mm (Figure 6). The shapes were predicted using the regression functions of relative warp I on centroid size.
Figure 6 illustrates the shape changes that occur in specimens, from both Samples 060700-2A and 052500-1C, in this size range. Specimens from the former sample develop isometrically, whereas specimens from Sample 052500-1C exhibit a displacement largely localized between landmarks 3 and 7. This displacement is the area of the byssal notch.
An examination of specimens from Sample 052500-1C suggests that the allometric development is due mainly to a widening of the byssal notch and a change in the shape of the anterior auricle. This change is confirmed by thin-plate spline visualization of the allometry, which was done by constructing splines of predicted specimen shapes, on relative warp I, at two centroid sizes, 4 and 7 mm (Figure 6). The shapes were predicted using the regression functions of relative warp I on centroid size.
Figure 6 illustrates the shape changes that occur in specimens, from both Samples 060700-2A and 052500-1C, in this size range. Specimens from the former sample develop isometrically, whereas specimens from Sample 052500-1C exhibit a displacement largely localized between landmarks 3 and 7. This displacement is the area of the byssal notch.
