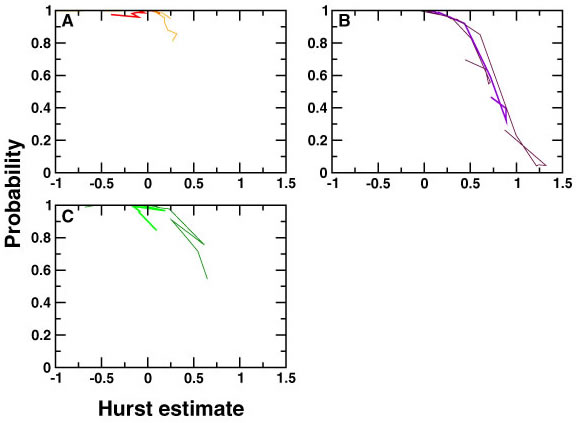
Figure 10. Hurst estimate analysis of the evolutionary pattern described by each stratophenetic series in Figure 9. Hurst estimates measure deviations from randomness (random walk), with values >> 0.5 indicating increasing directionality, while values << indicating increased constraint. Probability on the y-axis is the probability that that portion of the series is non-directional. Bold lines are mean Hurst estimates, while fainter lines are 5% and 95% confidence intervals. A and C (SVD I and SVD III) range between random oscillation and significant constraint, while B (SVD II) exhibits a significant episode of directionality early in the series.