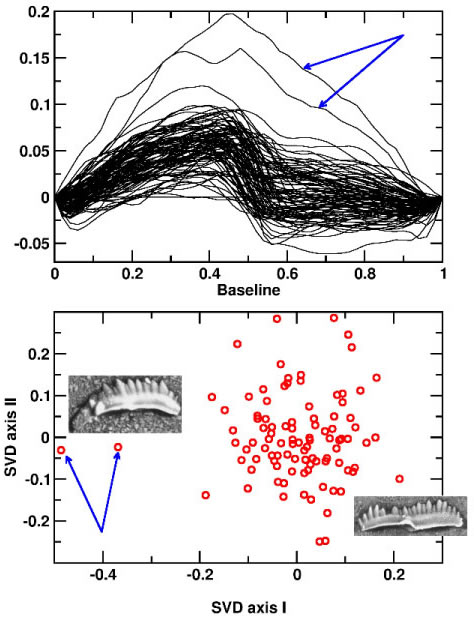
Figure 4. Standardized margin splines (upper) from a single sample illustrating an overwhelmingly common morphology, and the presence of two possible outliers. Y-axis represents variation in profile shape. Lower figure plots the specimen scores on the first two SVD axes, with an example of the common morphology, and the less common arched profile of the two outlying specimens.