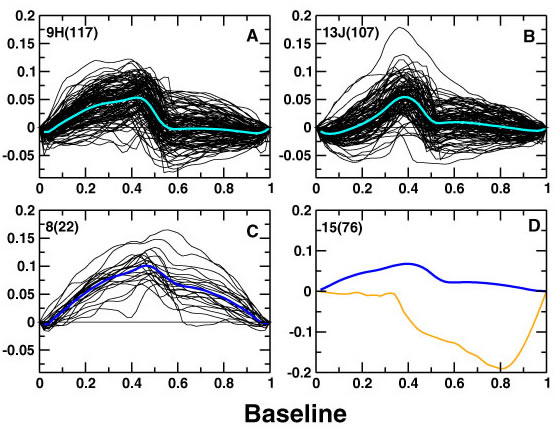
Figure 5. Four morphotypes discovered in the section by the standard spline analysis, corresponding to A) Wurmiella wurmi; B) W. tuma; C) W. n. sp.; and D) a single aberrant individual. Labels in upper left corners of graphs denote stratigraphic samples. Bold aqua and blue lines represent the mean spline of the sample, while the orange spline of the lower right graph illustrates the single aberrant specimen.