
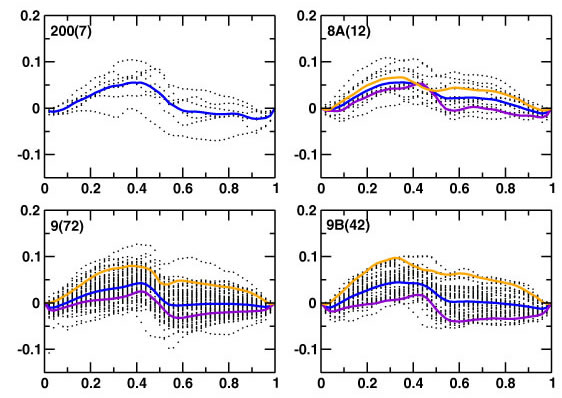
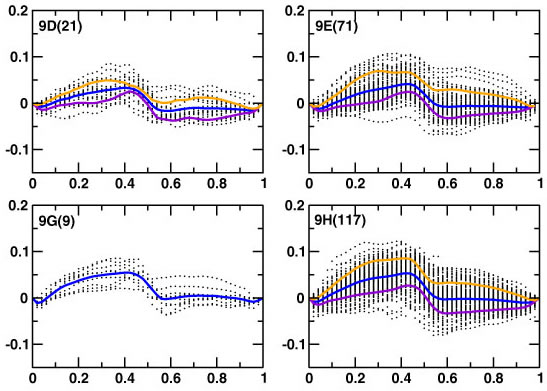
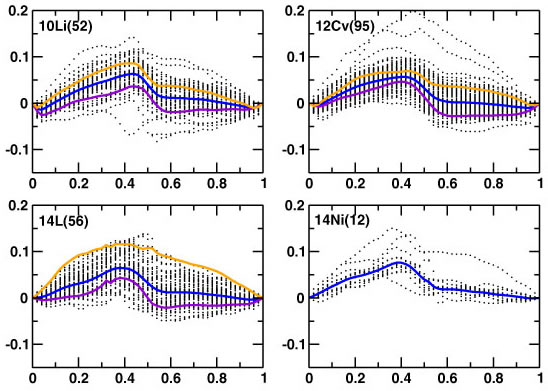
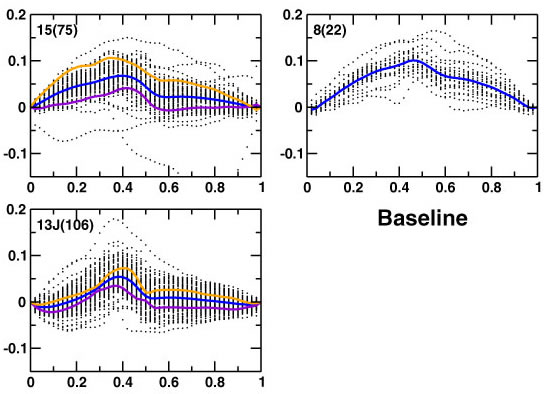
Figure 7. Allometric development in individual, single-taxon samples. Black dots represent individual specimens, whereas solid lines are least squares predictions derived from spline regressions on centroid size: violet - estimate of shape at lowest end of size range, blue - sample mean spline, orange - estimate from upper end of size range. Sample numbers are in the upper left corner. Samples 8 and 13J represent Wurmiella. n. sp. and W. tuma respectively, while all other samples are assignable to W. wurmi. Axes as in earlier spline figures.
 |
 |
 |
 |