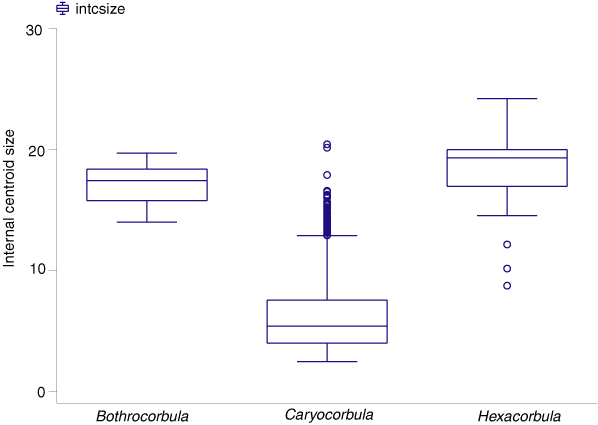
Figure 5. Spindle diagrams illustrating centroid size derived from internal landmarks for Bothrocorbula, Caryocorbula, and Hexacorbula. For each genus, the line within the box is median size, the box represents the 25% and 75% boundaries, brackets mark the 5% and 95% boundaries, and circles represent outliers.