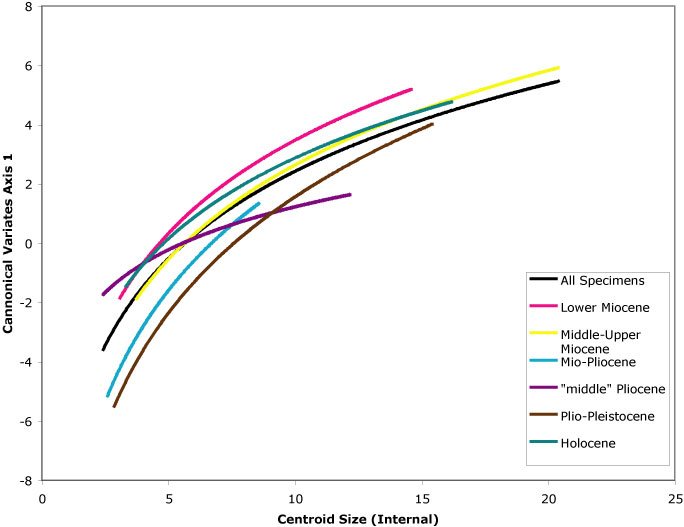
Figure 8. Allometric curves (fit with a logarithmic function) for all Caryocorbula (black line) and for the same data subdivided by time interval. Time intervals correspond to the following Ages in Table 2: Lower Miocene = Burdigalian + Langhian; Middle-Upper Miocene = Serravalian + Tortonian; Mio-Pliocene = Messinian + Zanchlean; "middle" Pliocene = Piacenzian; Plio-Pleistocene = Gelasian + Calabraian; Holocene = Holocene.