 Descriptive summary statistics for the variables length, ratio, number of serrations, and average serration width are presented in
Table 3 for each float sample.
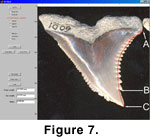
The relationship between five characteristics of the teeth is examined using several statistical tests. As noted, the variables of interest are (see
Figure 7):
linear regression age as assigned above.
total length of tooth's distal edge = spline length A to C
(unserrated tip length) / (total edge length)
(distance B to C) / (spline length A to C)
number of (distal) serrations between A and B
spline length AB / number of serrations
 Descriptive summary statistics for the variables length, ratio, number of serrations, and average serration width are presented in
Table 3 for each float sample.
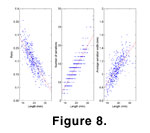
A one-way analysis of variance (ANOVA) finds significant differences between the four samples for length (p-value < .0001), ratio (p-value < .0001), number of serrations (p-value < .0001), and average serration width (p-value < .0001). The variables ratio, number of serrations, and average serration width are all strongly related to the overall tooth size as quantified by length. The scatter plots in Figure 8 of ratio, number of serrations, and average serration width versus length strongly suggest that longer teeth have a smaller ratio, more serrations and the average width of serrations is larger.
 To investigate the differences between the four float samples after adjusting for differences in tooth length, an analysis of covariance (ANCOVA) was performed for the variables ratio, number of serrations, and average serration width, with tooth length as the covariate. After taking into account variations in tooth length between the samples, there remained significant differences in ratio (p-value < .0001), number of serrations (p-value <.0001), and average serration width (p-value < .0001) between the four float samples.
There is evidence which suggests that ratio also is age dependent, specifically, that ratio decreases as geological age decreases. If a subsample (sPungo) of smaller Pungo River teeth is chosen having the same average length as the Belgrade sample, the average of ratio for the subsample is intermediate between the average ratios for the Belgrade teeth and the complete Pungo River sample (Table 4). This relationship will be explored further in the modeling below.
Assuming ratio to be a linear function of length and age,
the standard least squares (linear regression) algorithm determines the coefficients given in Table 5.
Similar analysis showed a significant negative trend with geological age for number of serrations (b2 = -0.062, p-value < .0001, R2 = 0.81) and a small but significant positive change with geological age for average serration width (b2 = 0.0042, p-value < .0001, R2 = 0.59), after accounting for differences in tooth length. Note that the particularly low R2 for this final model indicates that the trend in average serration width with age explains a relatively small portion of the overall variation in this measurement. The number of serrations increase as geological age decreases, and there is some evidence that average serration width decreases.
Note that unweighted least squares is optimal (gives minimum variance linear unbiased estimates) if the linear model is true; however, it is not necessarily optimal if the true relationship is not linear.
While any of the scatter plots in Figure 8 strongly suggest a linear relation between ratio, number of serrations, or average serration width and length, there is no such assurance regarding the relationship between age and the other three variables. For example, assuming ratio was dependent on a quadratic term in age would lead to a model
and performing a linear-in-the-parameters regression results in the coefficients given in Table 6.
Substituting the length and age information (for a given tooth) into a particular model produces a predicted value for the ratio of that tooth. The difference between the actual (observed) value of ratio and its predicted value (ratioo – ratiop) is termed the residual. A measure of how well the model fits the data can be obtained by examining the set of residuals. Two accepted measures for error are the mean of the residuals and the mean of the squares of the residuals. These are given in Table 7. These measures for the Calvert, Santee, and Recent samples are included in the table as well (although teeth from these groups were not used to fit the model). µRes = mean of the residuals, %err = the percentage of the mean of ratio that µRes represents for the sample, and µSq = mean of the squares of the residuals.
As can be seen from the mean residual columns, for the H. serra species the linear model (on average) overestimates ratio for both Pungo River samples and for the Calvert sample and underestimates ratio for the other four samples. However, the worst mean residual, 0.0154 for the Belgrade teeth, represents an error of less than 6% of the average ratio of the Belgrade teeth. In the quadratic model the mean residuals of all the float samples were quite small, smaller than in the linear model. For the Calvert sample this mean residual was larger than from the linear model but still represented an error of only 2.5% of the average value of ratio for these teeth.
For both non-serra species the average residual in the linear model was quite large, indicating that the linear model do not predict well for either of these species. The quadratic model does predict well for the H. curvatus teeth, but the sample is too small to lend much confidence to this result.
As can be seen in Figure 4, as an individual of the extant species ages, the number of distal serrations increases. Again using the distal edge length as a proxy for age, the same phenomenon occurs in the fossil species, as can be seen in the scatter plot (Figure 8) of the number of distal serrations versus the length of the distal edge.
As the geologic age of the samples decreases, the average number of serrations increases (see Table 3). For each tooth we can determine its average serration width by dividing the edge length (AB in Figure 7) by the number of serrations. Averaging over each of the float samples gives the values seen in Table 3. Curiously, the average serration width is virtually the same for all samples.