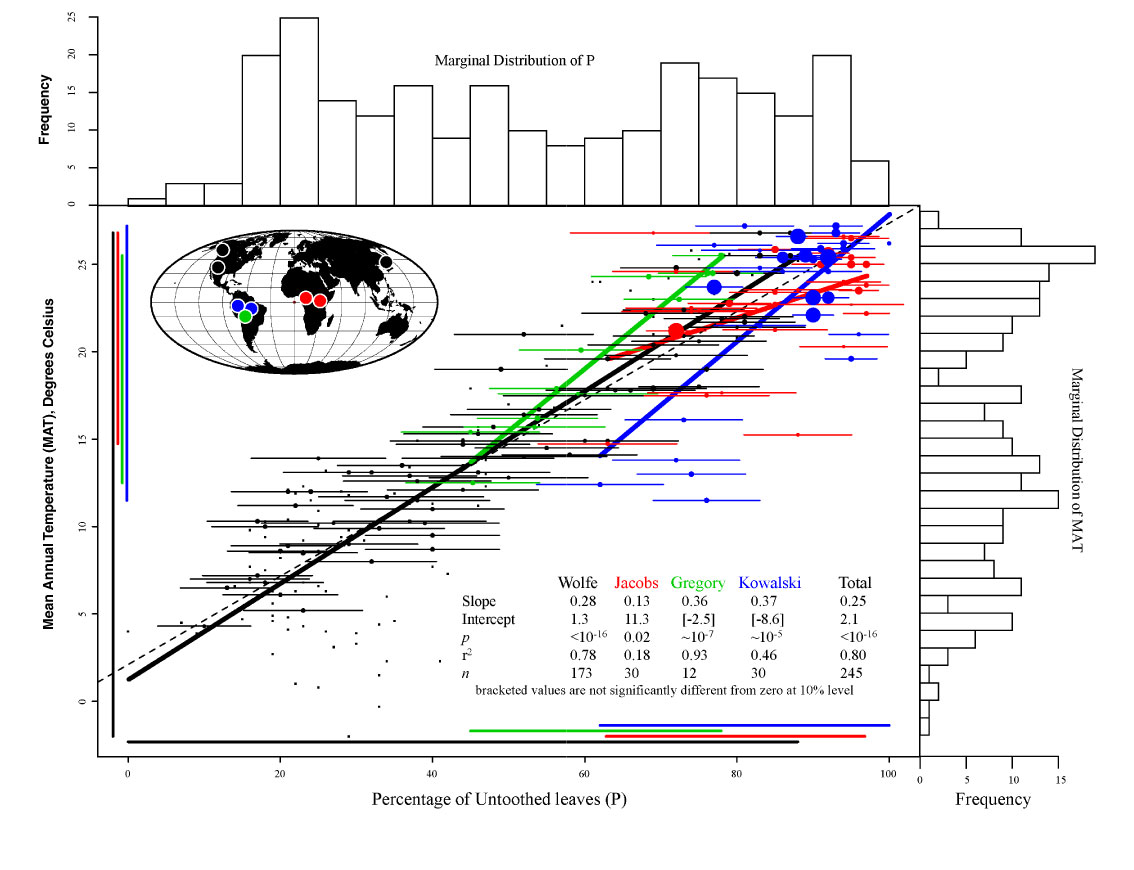
Figure 1. Comparative bivariate plot of temperature (MAT) against percentage untoothed leaves (P) for 245 floras and four studies, color-coded by study. Least-squares regression lines, marginal distributions, regression statistics, and the approximate geographical locations of the study areas are also shown. Points for which data are available on how many species are represented have error bars showing plus and minus the binomial sampling error. The size of the point plotted is also proportional to the sample size, except in the case where data are missing. The same colors representing the four studies are used in all subsequent figures.