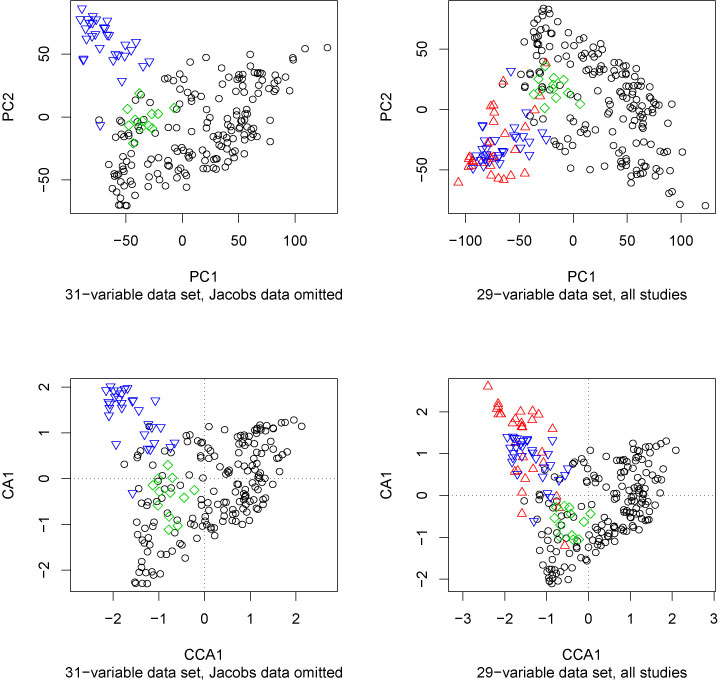
Figure 3. Principle components analysis biplots (top) and canonical correspondence analysis biplots (bottom) of the data. The left pair of biplots uses all 31 variables present in three of the studies; the right pair reduces the number of variables to 29 and shows all four studies. Note the basic similarity between the PCA and CCA plots: the scatters of points are viewed from different angles, but the relationships between studies are similar.