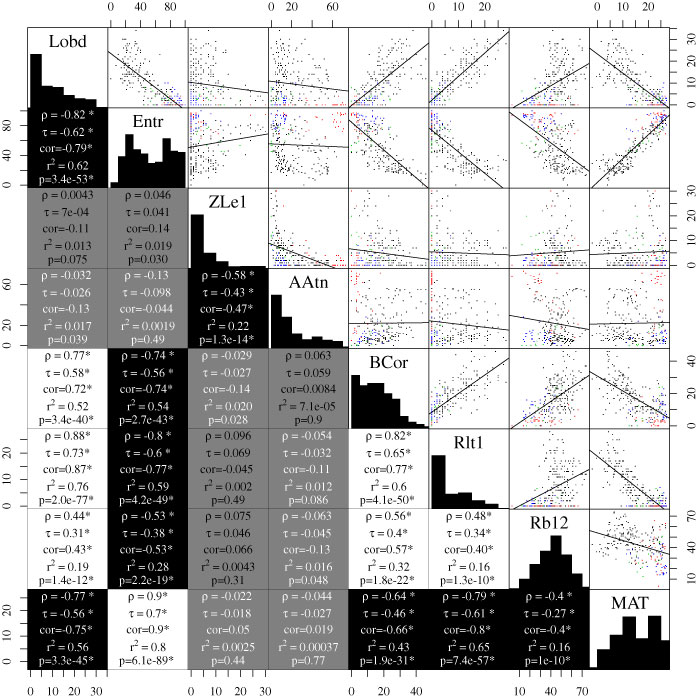
Figure 6. Pairs plot of selected variables.  is Spearman's rank order correlation coefficient;
 is Kendall's rank order correlation coefficient; cor is the ordinary (Pearson's) product-moment correlation coefficient; and the and p-values relate to the least-squares fitted line. Where the associated correlation tests (and in the case of the p-value, the regression) are significant at the 5% level, the statistics are followed by asterisks. The blocks are white with black text if the mean of the three correlations is positive and all four of the tests are significant, and they are light grey with black text if some, but not all of the tests are significant. The blocks are colored black and dark grey with white text in the reverse scenarios. If none of the tests are significant, the blocks are a medium grey and the sign of the mean of the three correlations is shown only by the color of the text printed on them: black for a positive and white for a negative correlation.
(For larger version click image.)
is Kendall's rank order correlation coefficient; cor is the ordinary (Pearson's) product-moment correlation coefficient; and the and p-values relate to the least-squares fitted line. Where the associated correlation tests (and in the case of the p-value, the regression) are significant at the 5% level, the statistics are followed by asterisks. The blocks are white with black text if the mean of the three correlations is positive and all four of the tests are significant, and they are light grey with black text if some, but not all of the tests are significant. The blocks are colored black and dark grey with white text in the reverse scenarios. If none of the tests are significant, the blocks are a medium grey and the sign of the mean of the three correlations is shown only by the color of the text printed on them: black for a positive and white for a negative correlation.
(For larger version click image.)