|
|
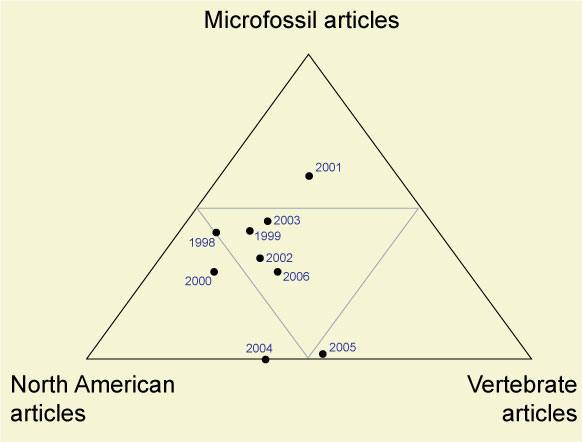
Figure 3. Triangle diagram showing the proportion (in percent) of three categories of articles during the years of PE.
|
|
|
Figure 3. Triangle diagram showing the proportion (in percent) of three categories of articles during the years of PE.
|