|
|
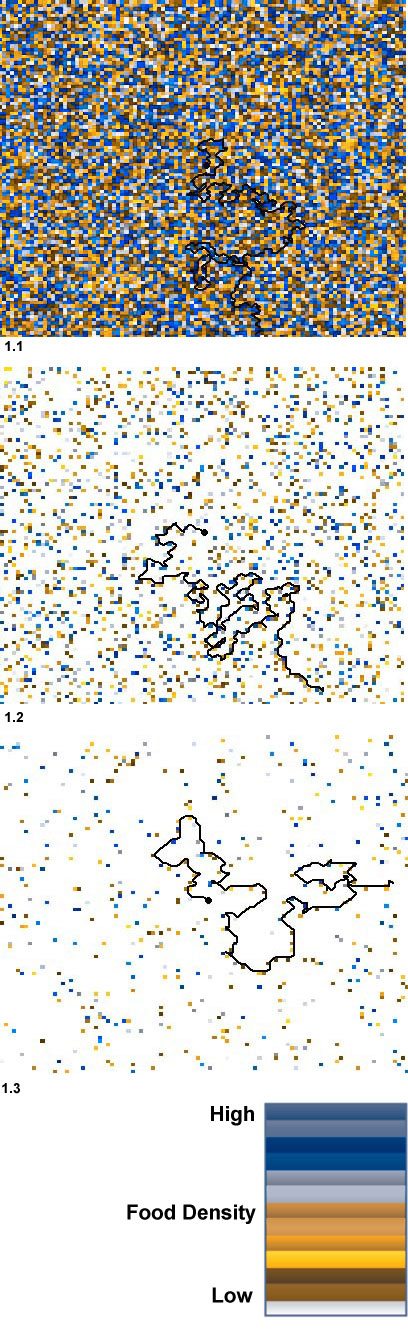
Figure 1. Simulations were run on 100 x 100 two-dimensional square lattices (maps). Map types were 1.1. all nodes containing resource (continuous), 1.2. 20% of nodes occupied, and 1.3. 5% of nodes occupied. Node occupation sites were chosen randomly; resource per node varied randomly from 0.00 to 1.00 (color legend). Representative movement trails are shown on each map (R = 4, no currents).
|