|
|
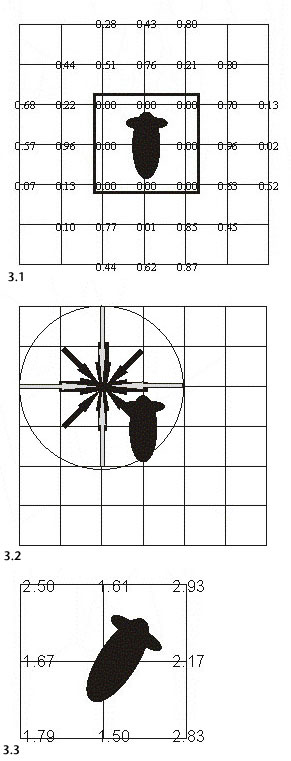
Figure 3. Distant chemotaxis algorithm. 3.1. Organism shown in center of an area of the lattice, each value indicates the amount of resource present at each node. The box indicates the area within which a waterborne signal can be directly detected. Numbered nodes are within the "detection range" of the organism. 3.2. Sources of summed chemical signal at location "northwest" of organism, assuming no net current direction. Thickness of arrows represents attenuation with distance D. 3.3. Signal at each location at which the waterborne signal is detected; assuming 1/D2 attenuation. Organism moves in the direction of the greatest signal ("northeast").
|