|
|
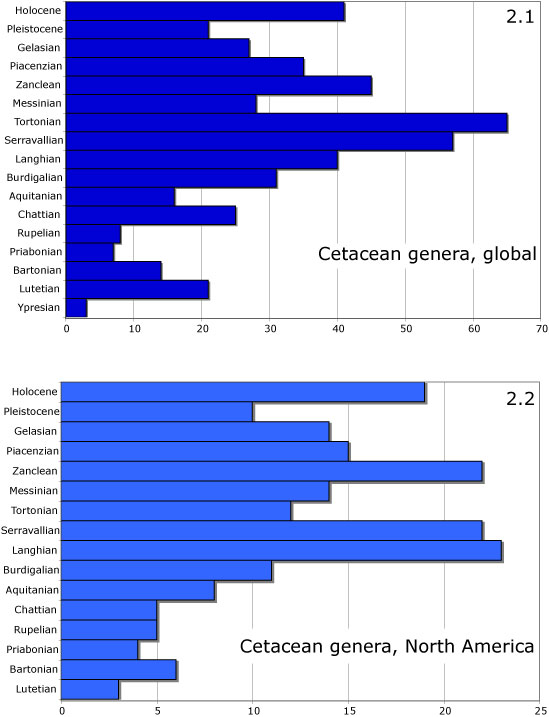
Figure 2. Cetacean generic richness. 2.1. Bar chart showing the number of cetacean genera described from each time interval for the entire world (dark blue). 2.2. Bar chart showing the number of cetacean genera described from each time interval for North America (sky blue). Note the similarity in the patterns of diversity, despite the different scales. Although the general shape of these distributions is similar, the first differences (the differences between one time interval and the next) are not correlated.
|