|
|
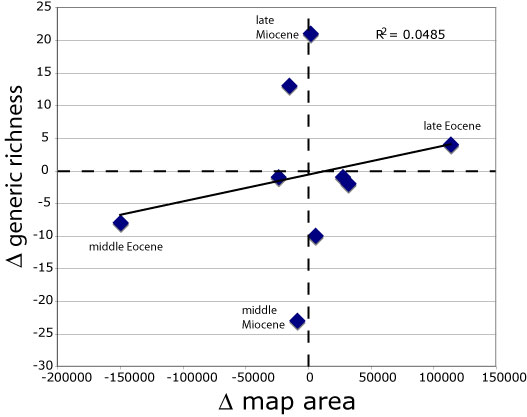
Figure 3. Subepoch-to-subepoch changes in the map area of continental shelf rocks for each time interval in North America and sampled North American cetacean diversity (not ranged through). The correlation between the two factors is poor. Spread along the rock area axis is mainly driven by the huge map area of middle Eocene rocks. Spread along the cetacean diversity axis is mainly driven by the huge diversity spike in the middle Miocene.
|