|
|
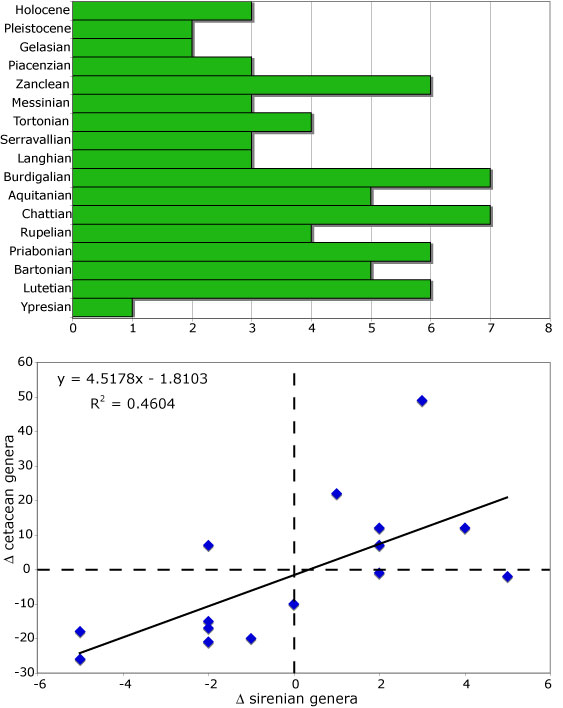
Figure 8. Sirenian diversity. 8.1. Bar chart showing the number of sirenian genera described from each time interval for the entire world. Note the much lower absolute diversity of sirenians in each time interval when compared to cetaceans. 8.2. Correlation of first differences of cetacean genera and sirenian genera (as sampled, not ranged through). Note that there is a general positive correlation, but not a signification correlation. This relationship suggests that different factors are affecting sirenian and cetacean diversity.
|