|
|
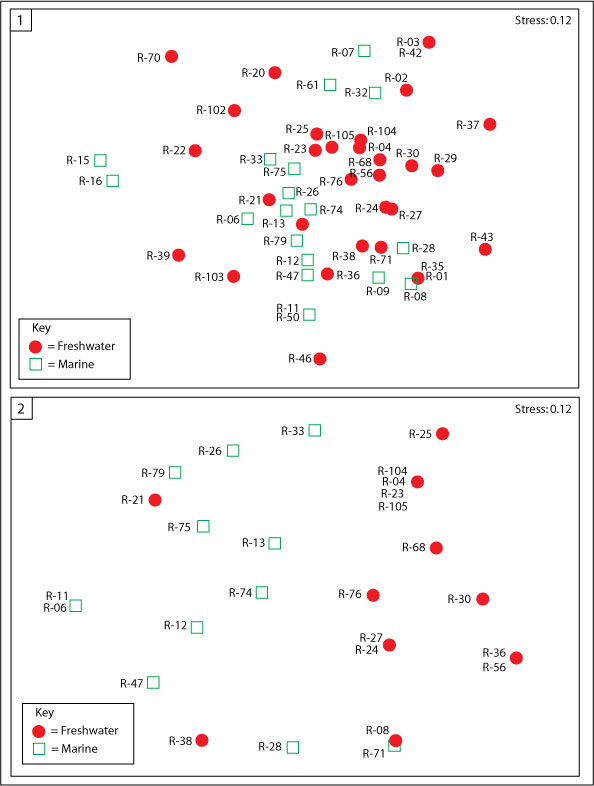
Figure 3. Ordination diagrams. 1. Analysis based on all species. Scatter plot of the sites plotted in the first two axis of a Multidimensional Scaling calculated using Bray Curtis dissimilarity. ANOSIM results: R = 0.028, P 0.222; 2. Results for taxa present in at least 20% of the samples (six taxa in 27 samples). Scatter plot of the sites plotted in the first two axis of a Multidimensional Scaling calculated using Bray Curtis dissimilarity. ANOSIM results: R = 0.292, P 0.03.
|