|
|
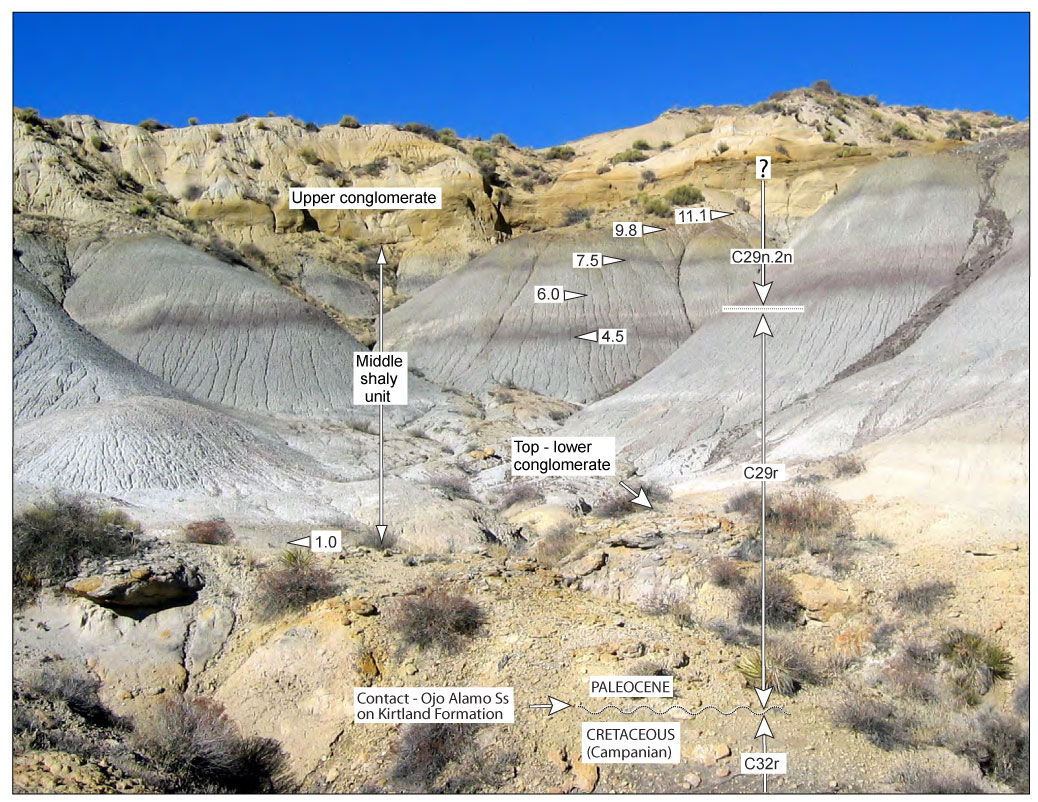
Figure 10. Photograph of South Mesa locality (looking north) of Lindsay et al. (1981); location is on Figure 3 and Figure 4. The paleomagnetic data plot at this locality is on Figure 8, Figure 9. (Paleocene magnetochron labels shown are corrected as discussed in the section of this paper labeled "Identification of Kirtland Formation-Ojo Alamo Sandstone Magnetochrons.") Numbers at arrow heads are distances above base of Ojo Alamo Sandstone in meters; sample levels are approximate. Arrow heads pointing left indicate reversed polarity, arrow heads pointing right indicate normal polarity. Sample levels estimated from Figure 9, but exact original sample localities are not known.
|