|
|
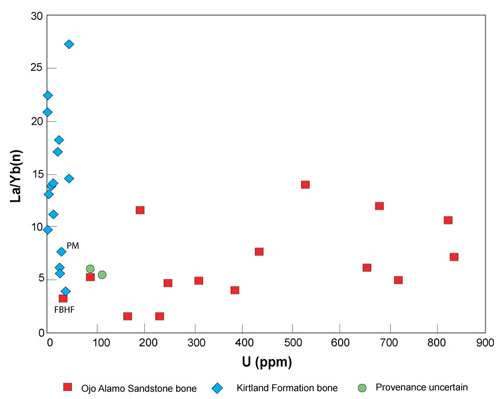
Figure 44. Plot of chondrite-normalized lanthanum/ytterbium ratios [La/Yb(n)] vs. uranium abundances (U ppm) for fossil bone samples from Ojo Alamo Sandstone and Kirtland Formation. Sample localities shown on Figure 1, Figure 4, and Figure 11. Elemental abundances on Table 2 and Table 3. PM is bone sample from Pot Mesa, FBHF is bone sample from San Juan River locality.
|