|
|
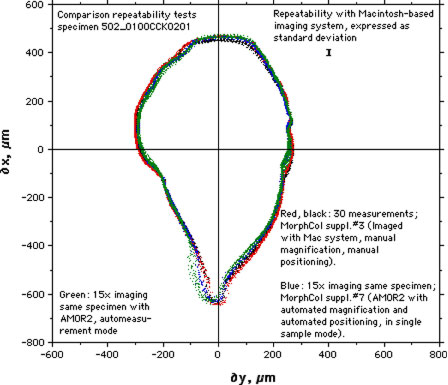
Figure 16. Comparison of repeatability experiments: Tests for manual positioning with a hemispherical stage and through a Macintosh-based digital imaging system versus automated positioning and imaging using the new AMOR system. The experimental setup and processing are described in supplements #5, #6, and #7 of MorphCol (see Knappertsbusch 2004). All outlines represent the same single specimen as shown in Figure 15. Delta X is the spiral height, Delta Y is the axial width of the shell in keel view. Explanation of colors: Red and black silhouettes (30 outlines in total) were taken with a Macintosh-based imaging system and a different camera and were manually positioned into keelview using the hemispherical stage. Blue silhouettes (orienting and imaging the same specimen 15 times) were generated using AMOR in single-specimen mode and with the auto-zoom enabled. Green silhouettes (orienting and imaging the same specimen 15 times) were generated with AMOR in auto-measurement mode. The obvious deviations of outlines in the lower left quadrant of the graph occurred because the specimen was removed from the slide after completion of the (earlier) Macintosh-based tests (red and black outlines) and later re-mounted to the measurement slide for doing the AMOR-based tests (blue and green outlines).
|