|
|
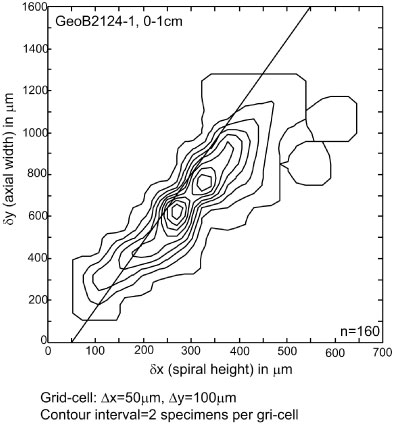
Figure 17. Example 1 of a bivariate frequency distribution of spiral height (Delta X) versus axial width (Delta Y) from 160 individual specimens of G. menardii in keel view from Holocene sample GeoB2124-1, 0-1cm and imaged with the new system of AMOR. The sample comes from the South Atlantic (Lat. 20.96° S / Long. 39.56° W, water depth 2003 m). The grid-cell size for counting frequencies was 50 micrometers in direction of Delta X (spiral height) and 100 micrometers in direction of Delta Y (axial width). The contour intervals are two specimens per grid-cell. The diagonal line was derived from several Pleistocene sample horizons in the Caribbean Sea (see Knappertsbusch 2007) and indicates a best visual separation between G. menardii cultrata (above line) and G. menardii menardii (below line). In individual – sometimes unimodal - samples such as the present one, however, there may be overlapping areas of one frequency mode with the other field, showing that numerical taxonomic subdivisions are always artificial. In this example the majority of menardiform globorotalids belong to the G. menardii menardii mode.
|