|
|
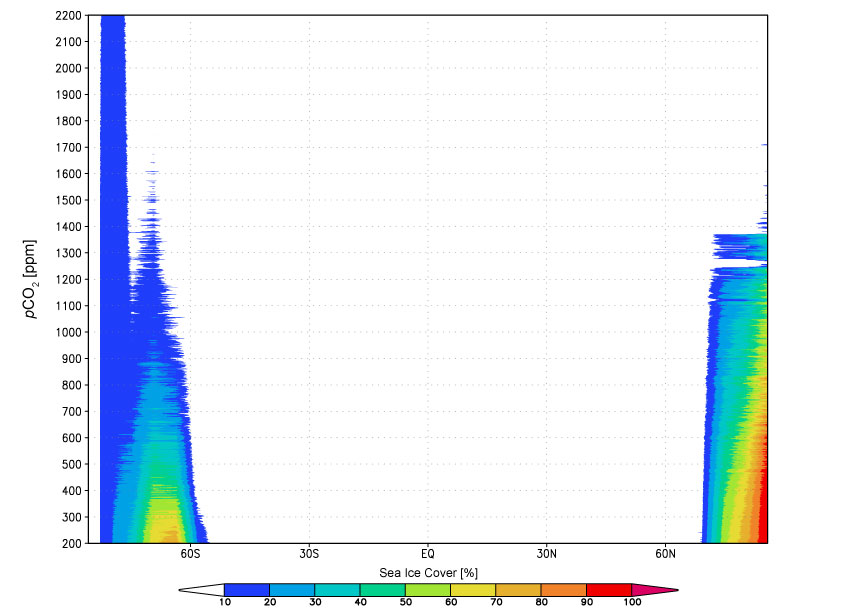
FIGURE 5. The zonal average sea ice cover [%] of TORT-INC plotted against the CO2 concentration [ppm] (vertical axis).
|
|
|
FIGURE 5. The zonal average sea ice cover [%] of TORT-INC plotted against the CO2 concentration [ppm] (vertical axis).
|