|
|
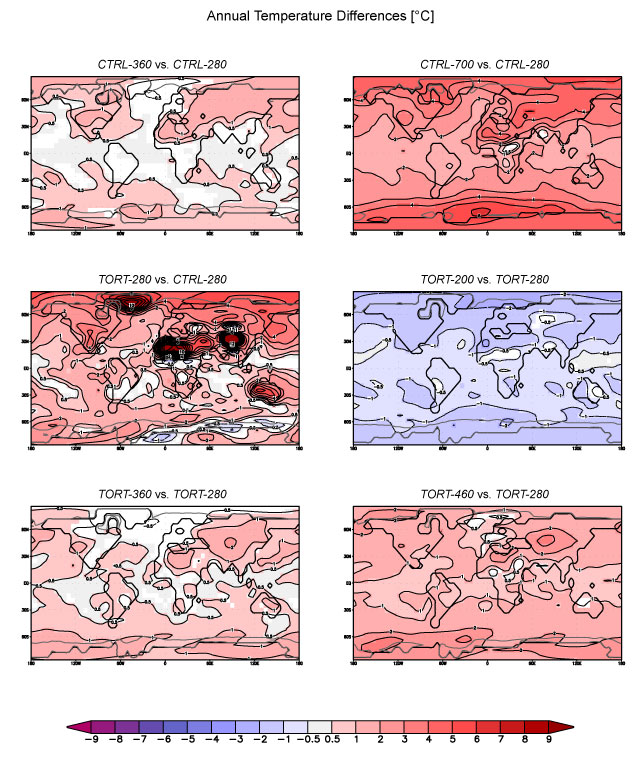
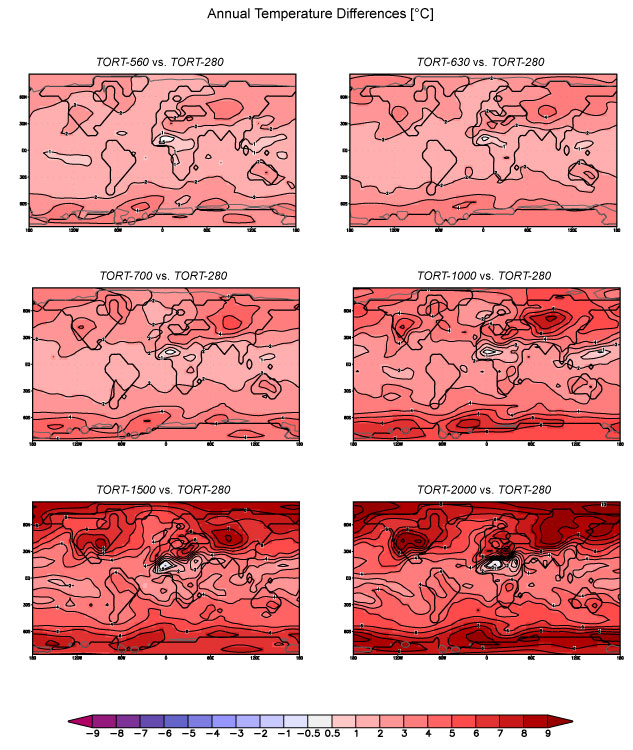
FIGURE 7. The annual average temperature differences [°C] and sea ice margin (grey solid line). TORT-280, CTRL-360 and CTRL-700 are shown as differences to CTRL-280, and TORT-200 to TORT-2000 are shown as differences to TORT-280, respectively. Non-colored white areas in represent non-significant differences with a Student's t-test (p = 0.01).
|