![]()
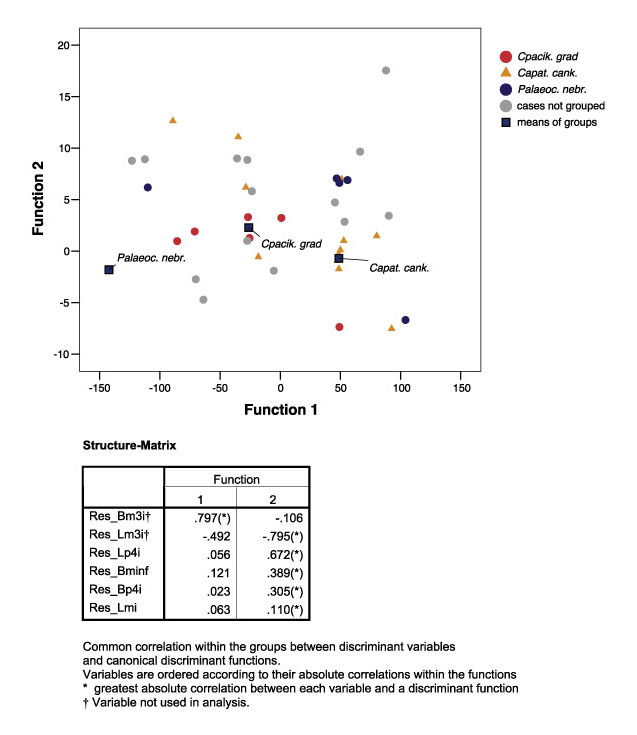
FIGURE 9. Discriminant analysis based on residuals of measurements of mandibular cheek teeth of the same taxa as in Figure 8. Structure matrix for function 1 to 2 is given; Statistical significance of function 1 to 2 (significance function 1 to 2 0.001, function 2 0.263). Abbreviations as in Figure 8.