![]()
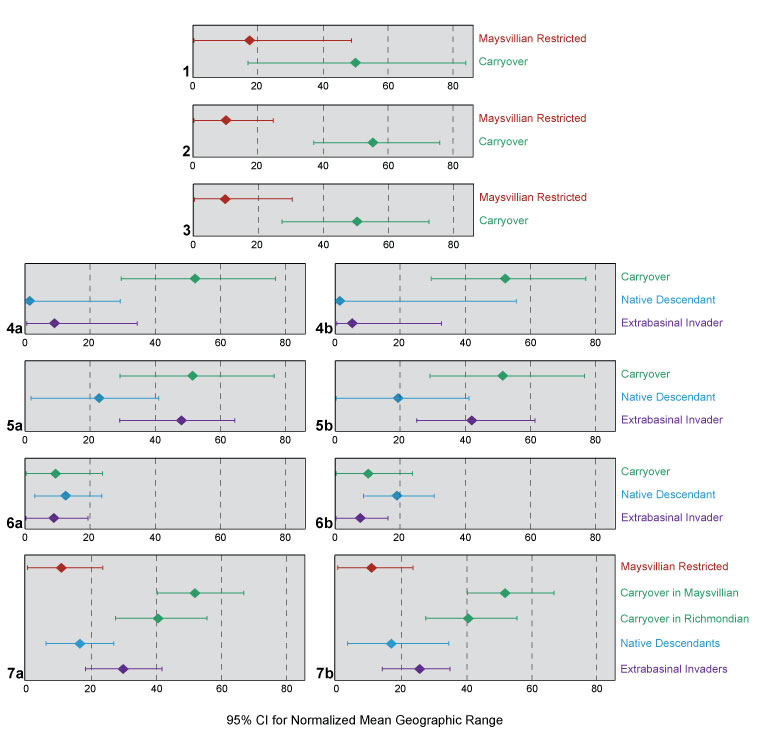
FIGURE 5. Comparison of the normalized mean species range from the area method for each species group by sequence (1-6 relate to corresponding sequence number) and for the entire study interval (7). 4-7 (a) treat Richmondian Strophomena species as native descendants, while (b) treat Richmondian Strophomena species as invasive. Individual 95% confidence intervals for mean geographic range are based on pooled standard deviation.