![]()
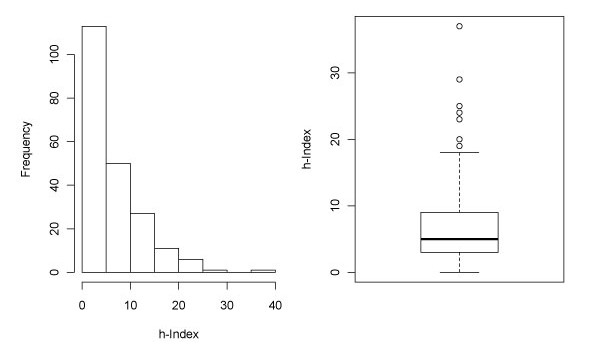
FIGURE 1. Distribution of Hirsch factor among 210 active, professional paleontologists in Germany. Left panel: A histogram of the data showing the number of paleontologists (frequency) per bin of h-factor. Right panel: a whisker plot showing the median at 5 and outliers at > 18.