![]()
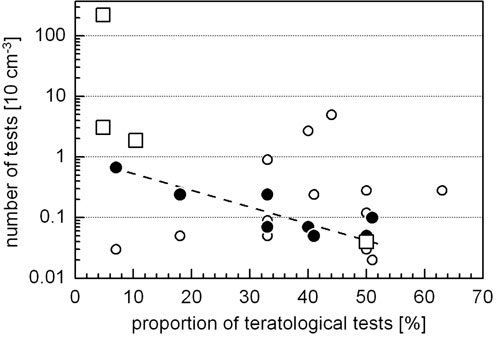
FIGURE 6. Proportion of teratological tests in the DMB. The amount increases with decreasing standing stock (stained tests) in the year 2000 (cruise M48, black circles, fraction >250 µm). The dashed line indicates exponential regression (n=8, r = 0.95, p >99.9%). This tendency is not derived from the unstained tests (cruise M48, open circles, fraction >250 µm). The juvenile generation which went extinct some time between the years 2000 and 2004 (cruise M57, fraction 150-250 µm) is marked by open squares.