![]()
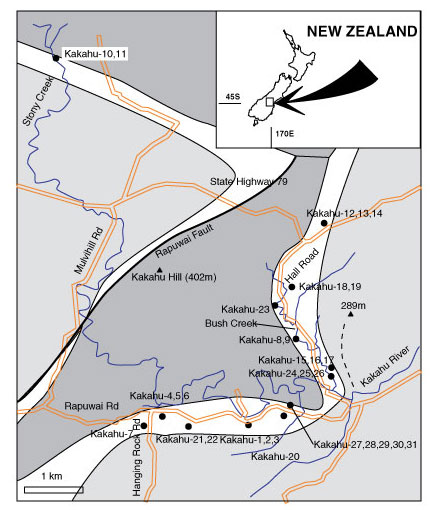
FIGURE 1. Locality map and basic geology (following Wellman 1953). Palaeozoic-Mesozoic basement is shown in dark grey, the coal measures are not toned, and the overlying Cenozoic marine is shaded light grey. Sample locations indicated by black dots.
|
|
FIGURE 1. Locality map and basic geology (following Wellman 1953). Palaeozoic-Mesozoic basement is shown in dark grey, the coal measures are not toned, and the overlying Cenozoic marine is shaded light grey. Sample locations indicated by black dots.
|