![]()
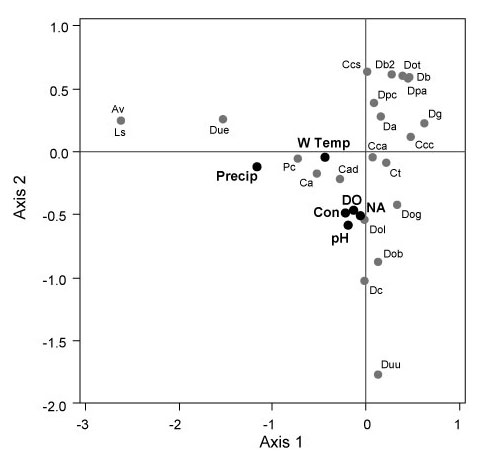
FIGURE 5. Canonical Correspondence Analysis (CCA) species-environment bi-plot, using the abundance of living species observed throughout the study. See Figure 4 caption to identify abbreviations.
|
|
FIGURE 5. Canonical Correspondence Analysis (CCA) species-environment bi-plot, using the abundance of living species observed throughout the study. See Figure 4 caption to identify abbreviations.
|