![]()
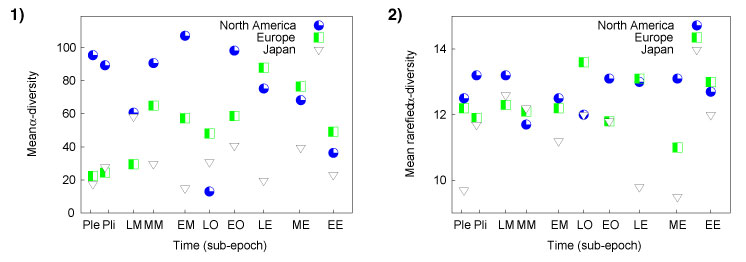
FIGURE 2. Mean alpha diversity for area-standardized grid cells by region
from the Pleistocene through Early Eocene (57Ma-0Ma). 2.1) Alpha diversity using the complete occurrence lists. 2.2) Alpha diversity using rarefied occurrence lists.
These show that North America is the most diverse through most subepochs even
using rarefied diversities, and that there is a general increasing trend in
North American un-rarefied diversity toward the present (left of plot), as
opposed to a decreasing diversity trend in Europe. These trends however,
disappear when rarefied plots are compared.