![]()
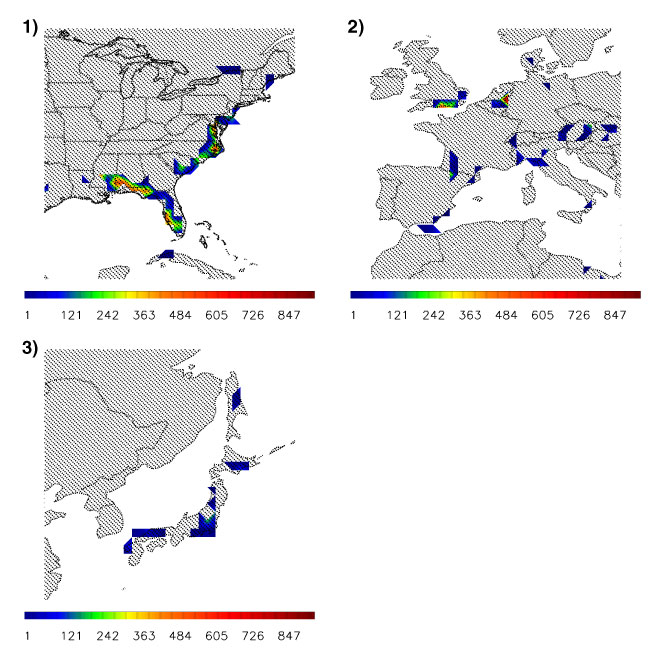
FIGURE 3. Total alpha diversity by region (57Ma–present). These
show that eastern North America is the most diverse region. The alpha diversity of grid cells are indicated by the colors plotted on the map. Hot colors (red) correspond to high alpha diversity. North America 3.1) contrasts strongly to Europe 3.2) and Japan 3.3).