![]()
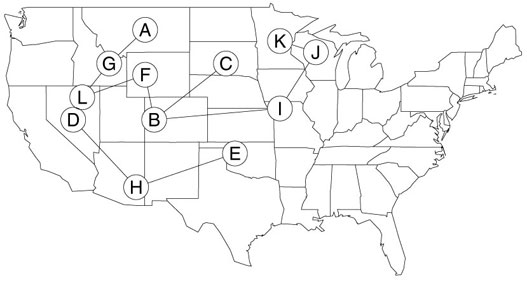
FIGURE 1. Minimum Spanning Tree for the fdata example data set from the fossil package, overlain over a map of the USA. Letters correspond to locality name.
>data(fdata.mat)
>fdata.dist<-dino.dist(fdata.mat)
>fdata.mst<-dino.mst(fdata.dist)
>data(fdata.lats)
>library(maps)
>map("state")
>mstlines(fdata.mst,coordinates(fdata.lats))
>points(coordinates(fdata.lats),pch=16,col="white",cex=3)
>points(coordinates(fdata.lats),pch=1,cex=3)
>text(coordinates(fdata.lats),labels=LETTERS[1:12])