![]()
FIGURE 3. Species area curve for the fdata sample data.
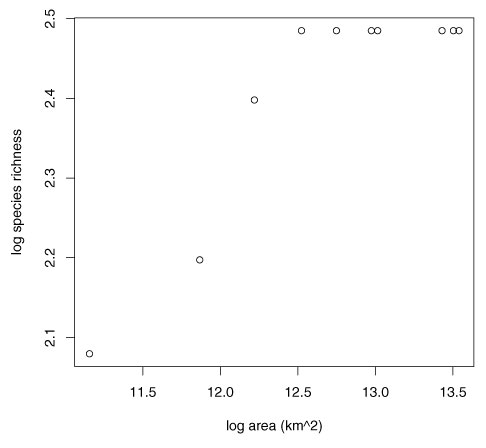
>plot(log(sac(fdata.lats,fdata.mat)[[1]]),ylab="logspeciesrichness",
+xlab="logarea(km^2)")
|
|
FIGURE 3. Species area curve for the fdata sample data.
>plot(log(sac(fdata.lats,fdata.mat)[[1]]),ylab="logspeciesrichness",
|