![]()
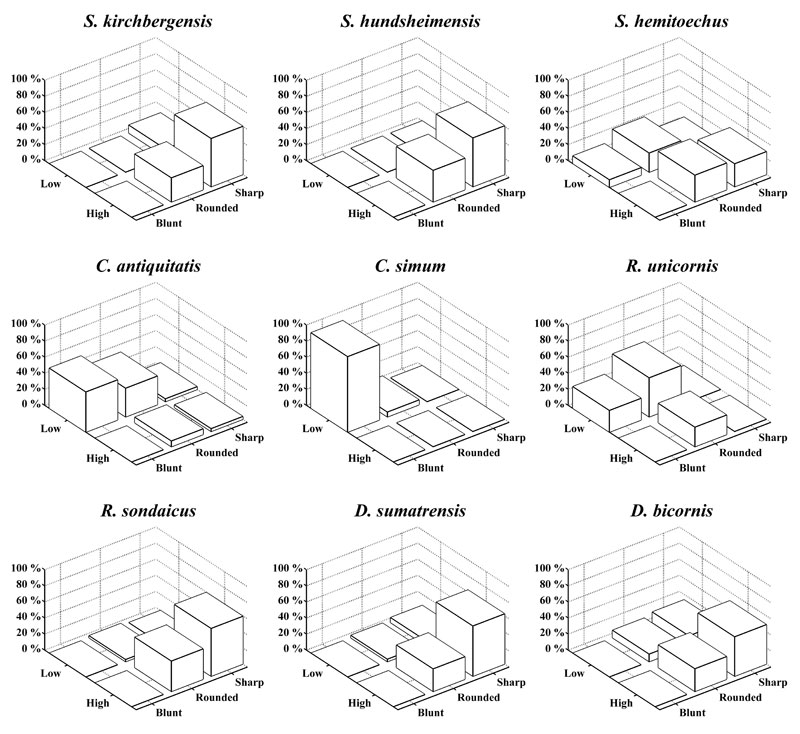
FIGURE 5. Bivariate bar plot of mesowear data of the upper molars M2 and M1, to show the combined distribution of occlusal relief and cusp roundness. From left to right, the height of the bars in the back row represent the percentage of cusps which are: low and blunt, low and rounded, low and sharp, and the bars in the front row represent the percentage of cusps which are: high and blunt, high and rounded, high and sharp.