![]()
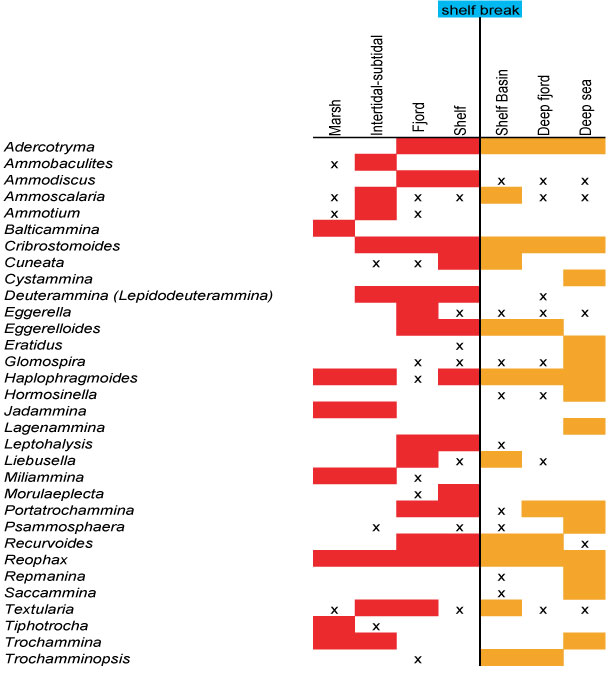
Figure 8. Distribution of ATA genera by environment, 1. Arranged alphabetically, 2. In order of occurrence. Red and orange = >10%; x = <10%. (x) indicates tests interpreted to be transported.
1.
2.
|
|
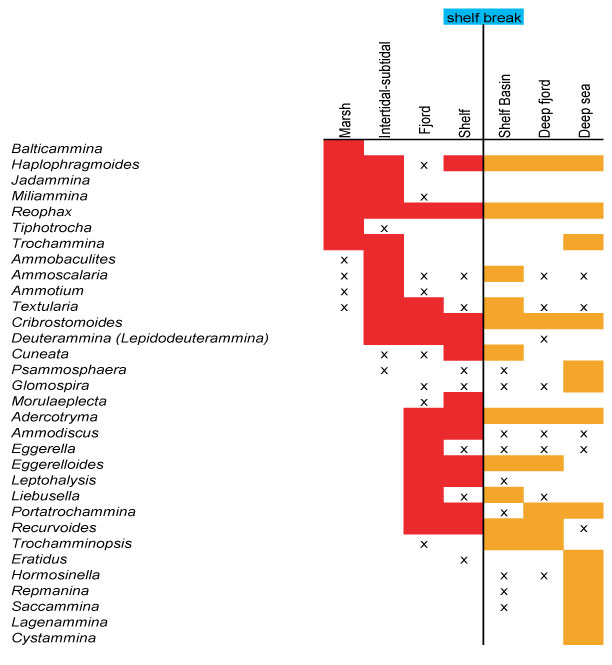
Figure 8. Distribution of ATA genera by environment, 1. Arranged alphabetically, 2. In order of occurrence. Red and orange = >10%; x = <10%. (x) indicates tests interpreted to be transported. 1.
2.
|