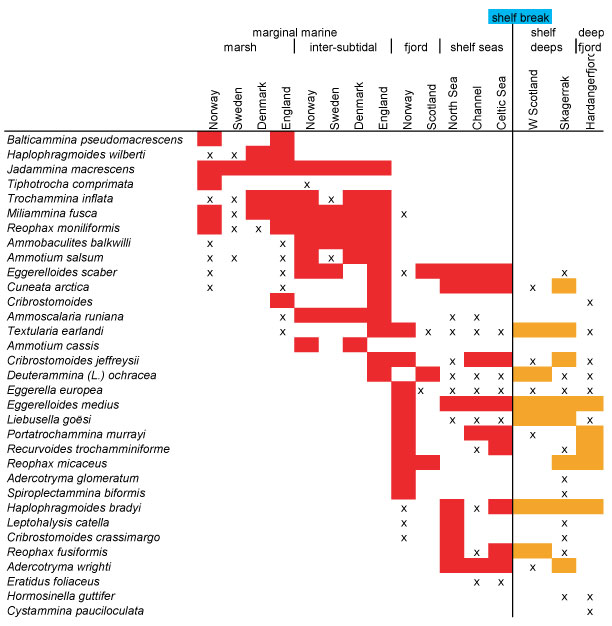
Figure 9.
Geographic distribution of ATA taxa. Red and orange =
>
10%; x = <10%.