 The Miocene climate in New Zealand: Estimates from paleobotanical data
Article number: 17.2.27A
https://doi.org/10.26879/436
Copyright Palaeontological Association, July 2014
Author biography
Plain-language and multi-lingual abstracts
PDF version
Submission: 2 November 2013. Acceptance: 20 June 2014
{flike id=780}
ABSTRACT
Miocene New Zealand was a small, highly oceanic landmass which makes it ideal for recording terrestrial climate, free of the complications of a continental setting. Fortunately, it has a good Miocene fossil record, both marine and terrestrial. This paper reviews past conclusions about Miocene climate then attempts to derive some key climate indices for the period using a variety of plant fossil proxies. The paper looks at three slices of Miocene time - a broad early to earliest middle Miocene time, a restricted period in the middle Miocene, and broader middle-late Miocene. The results suggest early to earliest middle Miocene Mean Annual Temperatures (MATs) reached at least 17-18°C, thus, about 6-7°C warmer than today (coastal areas of southern New Zealand today have a MAT of about 11°C). At times Miocene MAT may have reached 19-20°C. These figures support the cooler estimates of New Zealand Miocene climate that have been made previously by using palebotanical proxies, rather than those based on marine invertebrates. Based on plant fossils there is no evidence that New Zealand ever reached truly ‘tropical’ (i.e., megathermal) conditions (> 24-25°C). The climate in the middle Miocene is confounded by signs of precipitation and temperature change, and the rarity of leaf fossils. However, the data suggest both cooling and drying from the early Miocene. The presence of crocodiles yet the disappearance of palms, suggests a MAT that was at the lower end of existence for both of these groups, perhaps about 14°C. By the late Miocene, there is evidence for significant cooling, both from leaf size and a drop in plant diversity, which resulted in vegetation dominated in many places by Nothofagus.
Mike Pole. Queensland Herbarium, Brisbane Botanic Gardens Mt Coot-tha, Toowong, Qld, Australia, murihiku@yahoo.com
Keywords: foliar physiognomy, leaf size; paleobotany; climate change; fire
Final citation: Pole, Mike. 2014. The Miocene climate in New Zealand: Estimates from paleobotanical data. Palaeontologia Electronica Vol. 17, Issue 2;27A; 79p. https://doi.org/10.26879/436
palaeo-electronica.org/content/2014/780-miocene-climate-of-new-zealand
INTRODUCTION
The Miocene covers a very broad range of global climate conditions (e.g., Miller et al., 1991; Zachos et al., 2001). For example, the earliest middle Miocene includes the ‘Miocene Climatic Optimum’ - one of the warmest periods in the Cenozoic (Flower and Kennett, 1994; Böhme 2003) that in itself appears to cover a series of distinct climate fluctuations - ‘The Miocene Oscillation’ (McGowran and Li, 1994). This was followed, shortly after, by one of the most important climatic changes of the Cenozoic - a sharp drop in global temperature related to a major increase of ice on East Antarctica (Shackleton and Kennett, 1975; Verducci et al., 2007). By the close of the Miocene the West Antarctic Ice Sheet had begun to form as global conditions continued to deteriorate (Zachos et al., 2001). Deeper understanding of the mechanisms of these changes is a goal of global climate modeling.
New Zealand is a small landmass today with a mostly oceanic climate. In the mid-Cenozoic it was probably even smaller (the shoreline was regressing through the Miocene after peak submergence in the late Oligocene-earliest Miocene, Wilson, 1956; Landis et al., 2008), and with a much more reduced topography than it has now. Without the complicating effects of a large land areas and high topography, its climate would have reflected the global zonal situation more closely. That gives a particular relevance to the fossil vegetation of New Zealand in providing clear reference points for global climate (especially temperature) and atmospheric circulation patterns (especially rainfall). It is also located in a key, mid-latitude location, between the Equator (where the Cenozoic temperature changes have been controversial) and the South Pole, where the Miocene saw significant growth of the Antarctic ice sheet (Florindo and Siegert, 2009).
The aim of this paper is to review the published conclusions for Miocene climate in New Zealand and then to incorporate data from a range of fossil plant taxa in the light of more readily available databases and to compare results derived from independent paleoclimate techniques. Of particular interest is a re-evaluation of warmth in New Zealand during the Miocene Climatic Optimum.
New Zealand Climate Today
New Zealand lies in mid-latitudes, with the southern part, including the location of the Manuherikia Group (Douglas, 1986), one of the prime sources of Miocene plant fossils, lying further south than Tasmania. Only southern Patagonia lies at an equivalent latitude. This puts New Zealand largely under the influence of both the rain-bearing westerly winds and also the drying high pressure cells (Sturman and Tapper, 2005). At times the high pressure cells halt in their usual easterly tracking and remain motionless in the Tasman - a phenomenon known as “blocking” (Baines, 1983) and leading to drought.
The Southern Alps are an important control on the rainfall within New Zealand. They greatly enhance rainfall to the west, causing rapid weathering and loss of nutrients from soils, and cause a rain shadow to the east. New Zealand is also strongly affected by El Nino Southern-Oscillation events. Drought is common east of the Alps, and heavy rainfall events are common. Cyclones from more tropical latitudes periodically end their movement over the North Island and cause very intense rainfall events.
Mean annual temperatures (MAT) at sea level in New Zealand ranges from about 16°C in the far north, to around 9°C on Stewart Island (unless otherwise stated, current temperatures are taken from the Worldclim version 1.4, 2.5 minute grid, Hijmans et al., 2005). Central Otago, at about 45 °S (where many of the Manuherikia Group fossil assemblages described here come from), lies in an inland and mountainous region, and consequently has a strongly continental character of climate. However, the much more equable climate at the coast at the same latitude has a MAT of about 11°C.
Previous Estimates for Miocene Climate in New Zealand
Paleoclimate estimates for New Zealand should be put into two important contexts. Firstly, New Zealand lay at somewhat higher latitudes in the early Miocene than today (e.g., Veevers et al., 1991). At 20 Ma Central Otago lay at about 48 °S (i.e., around 3° higher, using GPlates, www.earthbyte.org, with the Müller et al., 2008 rotation model). If New Zealand lay in this position today it might be expected to be a little cooler, although it is noted that current MATs of the Snares and Bounty Islands that lie at this latitude are about 10-11°C (milder than Stewart Island). A figure of around 10°C can be regarded as a base against which most of the estimates for fossil assemblages can be compared. It would also be more strongly influenced by the westerly winds and polar fronts (the effect of the High Pressure cells would be less) and would thus be expected to have more continuous rainfall and fewer drought periods.
Secondly, during the Miocene New Zealand’s topography was considerably lower. The current major mountain range in New Zealand, the Southern Alps, are essentially a Plio-Pleistocene feature (Sutherland 1995, 1996; Youngson et al., 1998; Chamberlain et al., 1999). It follows that significant rain shadows would have been absent, and the other extreme of very high rainfall (with attendant rapid leaching of soil nutrients) would have been absent, too. However, buried early Miocene topography within the Manuherikia Group of more than 400 m is known (Douglas, 1986) and perhaps total topography - i.e., what lay around the edge of the basin, is likely to have been higher. This topography is likely to have had some ecological significance. Assuming a lapse rate of around 0.65°C per 100 m (Meyer, 1992; Wolfe, 1992), there would have been significantly reduced temperatures on the uplands than on the valley floors, and potentially distinct vegetation. Added to this may have been the ‘Massenerhebung’ phenomenon (Grubb, 1971; Flenley, 1995). This is found in the geographic tropics today, but if it operated in the early Miocene at higher latitudes, it may have produced a distinct cloud forest vegetation on low peaks.
In the following summary, quantitive limits for qualitative climate terms are only given if authors indicated what these terms were.
There has been research to understand New Zealand’s Cenozoic land and sea temperatures for more than 50 years. The palynological work of Couper (1953a,1953b, 1960a) provided some of the earliest evidence for the terrestrial climate of the New Zealand Cenozoic. Couper (1960b) recognized that pollen from the Miocene of Foulden Maar, near Dunedin, included “warmth-loving” plants, or those that were restricted to climates “warmer than today.” A landmark publication was “The Tertiary Climate of New Zealand Issue” of the journal ‘ Tuatara’ (Dawson, 1968) that summarized findings from a wide range of fields. Marine paleontological contributors to this publication had reached the conclusion that Miocene sea temperatures were significantly warmer than present. For example, fossil invertebrates were recognized that now only inhabit the warmer water of lower latitudes. Some of these suggested that waters may have been “tropical” (>25°C) at times (e.g., Keyes, 1968; Hornibrook, 1968). For the terrestrial climate, McQueen et al. (1968) based an argument on three groups of Nothofagus that could be distinguished by their pollen morphology. Nothofagus producing the “ brassii’ type of pollen are now restricted to mesothermal New Caledonia and New Guinea, whereas those producing ‘ fusca’ and ‘ menziesii’ forms are restricted to cooler Australia, New Zealand, and South America (unfortunately there is no place where all three coexist today, like they apparently did in the past). McQueen et al. (1968) argued that the three Nothofagus groups are favoured by different climates. The N. “ brassii’ group, were taken to indicate a climate of “constant humidity and one warmer than that occupied by the N. “ fusca’ group,” with the N. ‘ menziesii’ group indicating the coolest conditions. This meant that the relative proportions of the pollen of these three groups could then be used to estimate climate. The presence and abundance of other pollen types provided additional evidence for the climate. For instance Bombacaciditesbombaxoides ( Bombax ) and Cupanieidites (representing a clade within Sapindaceae) were taken as indicators of relative warmth. The abundance of Podocarpaceae pollen was noted whilst common proteaceous pollen was also used to suggest seasonal rainfall. Based on these arguments, McQueen et al. (1968) noted that pollen of the Nothofagus “ brassii’ group was dominant over the N. “ fusca’ group from the latest Oligocene to the middle Miocene. This became less pronounced in the later early Miocene, where there was a “bewildering floral combination” where warm climate indicators such as Bombacacidites mixed with cool climate indicators such as the Nothofagus “ fusca’ group.” They concluded that ‘subtropical’conditions existed at sea level, but cooler conditions on inland hills.
A qualitative measure of temperature was provided by Jenkins (1968), who graphed the total number of planktic foraminifera in New Zealand waters through the Cenozoic. Maximum richness, and likely maximum sea surface temperatures, was achieved in the early middle Miocene (Clifdenian local stage, around 15.2-15.9 Ma, Crundwell et al., 2004). Further climate clues were provided by stable isotopes from marine sediments and fossils. Devereux (1968) concluded that early to middle Miocene sea surface temperatures at the latitude of Wellington (currently 41° S) varied ranged from about 17-21°C. Shackleton and Kennett (1975) used isotopes to infer that Southern Ocean sea surface temperatures at a site currently at 52° S rose from about 6 or 7°C at the start of the early Miocene to a high of about 10°C. Later in the early Miocene there was a 2-3°C drop, but they rose again to nearly 10°C at the beginning of the middle Miocene. In the early middle Miocene temperatures fell abruptly by about 4°C.
However, disagreement was expressed between those workers using marine plankton and those who emphasised molluscan proxies (Kennett, 1967; Beu, 1974; Vella et al., 1975). At least for the late Miocene (Kapitean), the former argued for significantly cooler water (glacial) temperatures than the later. The molluscan workers saw very little change from earlier stages in the Miocene and maintained that even in southernmost New Zealand, water temperatures were “markedly warmer than those in northern Northland today .... and similar to present temperatures at the Kermadec Islands and at Sydney” (Beu, 1974, p. 471). Further evidence for distinctly warmer conditions was provided by Hayward (1977), who documented the presence of reef-building coral genera. He concluded that early Miocene sea water temperatures in the northern end of New Zealand were around 18-27°C, that is, 5-7°C warmer than today.
Hornibrook (1978) summarized New Zealand’s Cenozoic climate from isotopic data as well as marine and terrestrial paleontological data. The isotopic data suggested a peak of temperature in the latitude of Wellington (41° S) of about 19°C in the Otaian-Hutchinsonian, and then a second and higher peak of about 21°C in Altonian-Clifdenian time (about 4-5°C warmer than today). The paleontological record (see Hornibrook, 1978, figure 7.15) consistently suggested even warmer temperatures than the isotopic data by at least 2°C - i.e., peaking at about 23°C (20-25°C was classed as ‘subtropical’ by Hornibrook). Although the paleontological temperature curve is more subdued than that of isotopic data, it agrees on the timing and direction of marked climatic shifts.
A major review of the paleobotanical record of New Zealand was provided by Mildenhall (1980) who regarded New Zealand temperature as “reaching” subtropical in the early and middle Miocene, and becoming cool temperate in the late Miocene. He concluded New Zealand was never tropical. For marine conditions, Nelson and Burns (1982) carried out fine-scale (c. 35,000 year) sampling of foraminifera in the early Miocene (Otaian) for oxygen isotope analysis. Their results suggested either real water temperatures ranging from 15.4 - 19.1°C, or, if an Antarctic ice sheet existed, then the primary control may have been eustatic changes.
Palynological evidence was used by Mildenhall and Pocknall (1984) to conclude that warm temperate conditions prevailed in the early Miocene. Manuherikia Group sediments from near Cromwell/Bannockburn) were interpreted as everwet, although there were drier periods to “allow Mallotus or Macaranga shrublands to exist.” This was followed by Pocknall’s (1989) review of the Eocene - early Miocene climate based on palynology. He placed particular emphasis on the dominance of Nothofagus pollen as indicating that the climate was predominantly “cool temperate” (<°15C) and noted that at maximum global cooling in the late Oligocene, pollen of the Nothofagus ‘ brassii’ group was predominant in New Zealand. He concluded that the paleobotanical data did not support the isotopic conclusions that New Zealand had been warm temperate throughout the Late Eocene, but rather that it had been cool temperate from Late Eocene right through into the early Miocene. As a modern analogy, Pocknall (1989) pointed to the ever-wet highlands of New Guinea and quantified his estimate of MAT to about 13-18°C (although, note that this ranges from cool to warm temperate according to his figure 11). He noted that these forests have some of the plants, such as Anacolosa and the Cupanieae that earlier workers had regarded as tropical and subtropical indicators.
At the same time, Mildenhall (1989) summarized the climate of the Manuherikia Group as “warm temperate, probably never subtropical, moist and humid, although subject to periodic droughts.” He also emphasized the importance of fire in some areas. In the same year, Pole (1989) concluded that “early Miocene climate in New Zealand need not have been significantly different from that in forested regions throughout New Zealand today.” This was based on the proportion of entire margined leaf taxa from Manuherikia Group assemblages being similar to that at the higher end of the range observed in New Zealand today, and the leaf-size range of taxa being generally similar (microphyll-notophyll). Shortly later, Pocknall (1990) presented a similar summary Cenozoic temperature diagram to that of Hornibrook (1978), but although Pocknall (1990) stated it had been modified to show a lower peak of Miocene warmth, the difference is not obvious.
Adams et al. (1990) reviewed the evidence for the apparent discrepancy between the temperatures indicated by isotopic and paleontological data that had been raised by Hornibrook (1978). They focused on the evidence of large foraminifera, corals, and some plant taxa, and maintained that these genuinely indicated significantly higher temperatures in New Zealand during the Cenozoic than those suggested by isotopic data. In a second climate review Hornibrook (1992) confirmed the basic temperature conclusions of his first review. Once again a peak of temperature around the early-middle Miocene boundary was proposed, reaching perhaps 23°C based on paleontological evidence (“warm subtropical or possibly marginally tropical seas”), although the Canterbury region of the South Island may have been cooler. This peak was followed by a drop of around 2°C between the Clifdenian and the Lillburnian (early middle Miocene). The discrepancy between isotopic and paleontological data remained enigmatic, but Hornibrook suggested it may be partially explained by rapidly fluctuating temperatures from which the paleontological record is “smoothed,” or perhaps from localized marine upwelling.
On the basis of “coconuts, reef corals, and larger foraminifera” Hayward et al. (1990) concluded that in the Late Oligocene (Duntroonian) New Zealand had warmed to “subtropical” as far south as Coromandel in the North Island, and that warming then continued through the early Miocene to be even higher in the late Altonian - Clifdenian (citing Beu’s 1990 record of molluscan diversity as support). However, they did note that despite the presence of fossil reef-forming coral genera in New Zealand, no actual reefs had been found, and that this was probably because truly tropical temperatures were not reached.
Pole (1993a) discussed the paleoclimate and ecology of early Miocene leaf fossil assemblages of the Manuherikia Group in the Cromwell region. The main conclusion was that a variety of floral assemblages were present - and that these had resulted from fluctuations in temperature, rainfall, and the presence or absence of fire. Inferred rainforest assemblages were compared to modern “microphyll” and “notophyll” rainforests of Australia (Webb, 1959), which very broadly relate to the microthermal - mesothermal temperatures of Nix (1982). The paper also included a table (Pole, 1993a, figure 5) that illustrated somewhat different concepts of climate terms such as “subtropical” as used by some workers. Further work in the Manuherikia Group resulted in a palynological zonation (Pole and Douglas, 1998) that was argued to reflect broad climatic regimes. In particular, the base of the Casuarinaceae Zone or the Asteraceae-Chenopodiaceae Zone was suggested to correlate with the major global cooling at approximately 14 Ma.
Morgans et al. (1999) drew attention to a possible fluctuation in climate around the Waitakian-Otaian boundary at the Otaian type section in south Canterbury, something apparent in the marine invertebrate record, but so far, not from terrestrial proxies. They concluded the water temperatures were cool while those on land were warm.
A novel approach to the Miocene climate of the central North Island was provided by Moore and Wallace (2000) based on an analysis of fossil wood. The changing composition of wood samples was used to infer a sequence of relatively warm conditions in the early and middle Miocene, with prominent Nothofagus, Casuarinaceae, and Agathis, to relatively cool in the late Miocene with Nothofagus, Phyllocladus, but no Agathis. A new perspective to New Zealand’s climate history was added by Nelson and Cooke (2001), who analysed the development of the oceanic fronts to the south of New Zealand. They concluded New Zealand was surrounded by Subtropical Water. This water mass lies to the north of the Subtropical Front, where surface waters range from c. 10̶15°C throughout the year. In the earliest Miocene the southern part of the country was surrounded by Cool Subtropical Water while Warm Subtropical Water flowed around the rest (the distinction between Cool and Warm Subtropical is c. 20°C, Hornibrook, 1992). In the warmest part of the Miocene, Warm Subtropical Water extended all around New Zealand.
A little later, Field et al. (2002) integrated marine proxies for the middle Miocene of New Zealand to conclude that warm temperate surface waters passed up the west coast and down the northern tip, while cooler waters flowed past the southeast margin of the land mass.
A further review of the palynological evidence for the Miocene climate was provided by Mildenhall et al. (2003), who maintained, again in contrast to Pocknall (1989), that the early Miocene climate was warm temperate. In the same year, Pole (2003) argued that New Zealand’s Neogene climate, specifically the sequence of apparent temperature, moisture availability and presence or absence of fire, could be explained by a model where the tracking latitude of subtropical high pressure cells moved from the south of New Zealand to the north. The significant climate changes that this caused are reflected in the Manuherikia Group, which probably recorded much of the Miocene. Pole (2003) and Pole et al. (2003) also noted that the crocodile reported by Molnar and Pole (1997) occurred in the Casuarinaceae Zone (of Pole and Douglas 1998). This was a time when shallow-water habitats changed from swamp forests to herb fields, and probably post-dated the global cooling event at 14 Ma.
One of the few full palynological lists and counts for a Miocene location, Foulden Maar, was presented by Bannister et al. (2005). Based on the “highly diverse angiosperm pollen flora” they regarded the climate as “dry, warm temperate to subtropical.” Shortly after, more isotopic evidence for the New Zealand region came from Cooke et al. (2008) who analysed sea surface temperatures for DSDP Site 593 in the southern Tasman Sea. This is located at 40° 30’S, adjacent to central New Zealand, but was at least 4° latitude south of its present position during most of the Miocene. Cooke et al. (2008) warned that the results were tentative and unfortunately, due to part of the record being missing, only the first half of the Miocene Climate Optimum was present. The record of the planktic foraminifer Zeaglobigerina woodi indicated sea surface temperatures of 12.5-14.5°C, that then sharply warmed by about 2°C into the Climate Optimum. Over the portion of the Climatic Optimum that was preserved, there were large fluctuations of more than 4°C, but maximum temperatures sea surface temperatures of about 18°C were reached.
Mildenhall et al. (2003) and then Field et al. (2009) assessed the paleoclimate of Bryce Burn, Southland, the type section for the middle Miocene in New Zealand, based on palynology. The vegetation was said to be (Field et al., 2009, p. 329) “warm temperate,” (p. 331) “subtropical” and (p. 329) containing the “tropical genera” Mallotus and/or Macaranga. In addition to rainforest, “dry sclerophyll forest” also existed “in places and at times.”
Worthy et al. (2011) described mid Miocene climate as being “tropical” (in the title) and “subtropical” (in the text, p. 51). Their description of the vegetation envisaged common palms, and they cited further evidence from the associated bird fossils, e.g., “Ancestral flamingos and swiftlets are strictly tropical today” (p. 53).
There is thus a continuing issue in New Zealand where marine paleontology indicates warmer temperatures than the isotopic data, which in turn are warmer than some paleobotanical conclusions. Recent paleoclimate models (e.g., You et al., 2009; You, 2010) tend to infer conditions more similar to the cool paleobotanical estimates. Marine invertebrates have been used to suggest sea surface temperatures consistently above 20°C during the early and middle Miocene, and peaking at around 23°C during the Miocene Climatic Optimum. Isotopic data suggest significantly cooler temperatures, with the most recent results of Cooke et al. (2008) suggesting a Climate Optimum peak 5°C lower than marine paleontological data (c. 18°C). Estimates from paleobotany range from 13 to 18°C and, to some extent; it is likely that these limits indicate a range within which temperature fluctuated. It is noted that there is a global issue in that proxy data tend to indicate a more reduced global thermal gradient than what can currently be produced by climate models (Krapp and Jungclaus, 2011).
MATERIALS AND METHODS
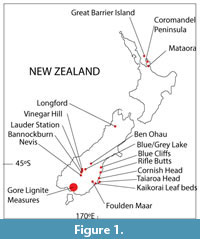 Miocene leaf fossils are known from throughout New Zealand (Figure 1) although with a very uneven distribution within this time period. This paper considers climate in three broad slices of Miocene time. The earliest slice is represented by the lower Manuherikia Group, including the Dunstan Formation and Nevis Oil Shale Member, the Gore Lignite Measures, and the Foulden Maar in southern New Zealand (a discussion of stratigraphy is given as Appendix 1). The Foulden material has been directly dated to the earliest early Miocene (Lindqvist and Lee, 2009), whereas the other two areas cover a wider range of time that includes the early Miocene and probably the early middle Miocene (Pocknall and Mildenhall, 1984; Mildenhall and Pocknall, 1989; Pole and Douglas, 1998). It is highly likely, by comparison with similar but much better dated coal sequences in Australia (e.g., Holdgate et al., 2007) that some of the plant fossil assemblages will include the Miocene Climatic Optimum.
The second time slice is represented by bone-bearing mid-Manuherikia Group sediments, the Ewing Submember. These were argued by Pole and Douglas (1998), as being immediately post the 14 Ma, middle Miocene, global drop in temperature although this has been challenged by Field et al. (2009). Plant macrofossils are almost absent from these sediments, but there is a growing range of vertebrate fossils (Molnar and Pole, 1997; Worthy et al., 2007), together with other potential proxies such as stromatolites (Lindqvist, 1994).
The third time slice includes a variety of middle to late Miocene sites, including the middle Miocene (Booden et al., 2012), of Great Barrier Island, the latest middle Miocene (Coombs et al. 1960, 1986, 2008) of Kaikorai Valley in the Dunedin Volcanic Complex, and the late Miocene (Brathwaite and Christie, 1996) of Mataora (in the Coromandel Peninsula, North Island).
The localities are discussed in more detail as Appendix 2, and the key plant taxa involved are discussed as Appendix 3. New parataxa are described in Appendix 4 and a key to all leaf parataxa in the Manuherikia Group and Foulden Maar are in Appendix 5. A summary of the distribution of all Linnaean taxa is presented as Appendix 6. Angiosperm families follow the Angiosperm Phylogeny Group (2009).
Climate from the Co-existence Approach
Kershaw and Nix (1988) used bar graphs to illustrate the climatic ranges of pollen found in a Holocene deposit in North Queensland, and then Sluiter et al. (1995) used the same techniques for the extant relatives of fossils found in the Miocene Latrobe Valley coal measures in Victoria. These workers reasoned that the past climate could be deduced from the zone of overlap of the ‘envelope’ for particular climate variables. For example, Sluiter et al. (1995) concluded that the Miocene MAT in the Latrobe Valley was around 19°C, 4-5°C warmer than today. Zones of overlap were also found for other climate variables, such as mean annual precipitation, precipitation of the driest month, and precipitation of the wettest month. They concluded that the annual rainfall was significantly higher than today. However, to achieve these results, the data needed some manipulation. They excluded from consideration obvious climatic outliers and also some taxa that were present as pollen, but not as macrofossils and known to have widely dispersed pollen. This was on the grounds that they may have been growing in cooler and wetter higher-altitude communities marginal to the coal basin (these included Phyllocladus and Nothofagus s.g. Lophozonia ).
In looking for regions of overlap, Kershaw and Nix (1988) limited the climate values of extant plant taxa to the 25-75 percentile range of their known limits. This sometimes meant that there was no overlap of taxa and in these cases it was extended to the full range. In their later paper, Sluiter et al. (1995) expanded the climatic envelope of any one taxa to the 5-95 percentile, to exclude “errors in plant identification or data entry”.
Since Sluiter et al. (1995), the “co-existence approach” (CA) has been highly developed by German researchers (e.g., Mosbrugger and Utescher, 1997). It relies on the extremely refined macrofossil taxonomy that has developed over many decades in Europe. Rather than simply looking at the range of co-existence of the lowest taxonomic level that a fossil can be identified with (i.e., a family or a genus), CA nominates an extant species as the Nearest Living Relative (NLR) for each (or at least many of) the fossils. This approach looks for the range of climate where most of the NLRs could co-exist. Despite its apparent success in several European fossil deposits, a recent evaluation has described it as “useless” (Grimm and Denk, 2012).
A version of the co-existence approach was employed by Reichgelt et al. (2013), who constructed their climatic envelopes on a geographically restricted basis, as well as using a narrow percentile range (10-90). For this approach they cited Thompson et al. (2012) who studied the contemporary vegetation of North America, and who used a species-range dataset that was a digitization to a grid made from published outline maps of geographic range. They were aware that these were mainly abstractions, for example noting instances where small areas of high elevation were included in the overall range. These would have given false presences in regions too cool for the taxon. Thompson et al. (2012) found they achieved better results when they dealt with outliers, for example by restricting to the 10-90 percentile. However, the dataset of Thompson et al. (2012) is fundamentally different from the current paper, where species distribution is based on specific locations of individuals, not outline maps. In these cases, a reduction to the 10-90 percentile is simply deleting good data, and the increased performance claimed by Reichgelt et al. (2013) is a result of narrowing the dataset. Furthermore, in forming their climatic envelopes Reichgelt et al. (2013) excluded New Guinea (which Pocknall (1989) specifically suggested as a good analogue for New Zealand in the Eary Miocene) and South America - on the basis that it was uncertain “how much evolutionary divergence could have occurred within genera since the breakup of Gondwana.” However, the amount of “evolutionary divergence” between the landmasses they did include is also uncertain, so the choice was entirely arbitrary. Where considerable “evolutionary divergence” is obvious, for example between the extant Australian sclerophylls Isopogon and Petrophile, and whatever rainforest plant produced the pollen fossils in Reichgelt et al. (2013), the extant genera are still used to form the climate envelope. Reichgelt et al. (2013) chose to base the climatic range for Ilex (Aquifoliaceae) on only I. arnhemensis (a species restricted to the tropical lowlands of northern Australia), while ignoring the high diversity of Ilex in the cool mountains of New Guinea on the other side of Torres Strait. They explained that “geographical restrictions should make I. arnhemensis from Australia or I. sebertii... from New Caledonia the closest living relatives of the Ilex from early Miocene New Zealand.” This is spurious, as New Guinea is geologically part of the Australian continent (Torres Strait is an ephemeral body of water, exposed during glacial periods). In effect, they have made it clear that they are now not dealing with a climate envelope for a genus, but for a Nearest Living Relative (in the sense of Mosbrugger and Utescher, 1997). Exclusion of major parts of a taxon’s range both geographically and by a 0.90 percentile limit will alter the results beyond the ±1°C error Reichgelt et al. (2013) gave for their MAT conclusions (Appendix 7 illustrates this further).
In this paper the primary concern with climate envelopes is not to find the MAT for specific assemblages, but to establish the broader limits of MAT. The primary questions are: at least and at most, how warm did the early-earliest middle Miocene of southern New Zealand get?
The linking of data from many of the world’s herbaria online so that they may be accessed, freely, through a single portal, the Global Biodiversity Information Facility (GBIF) now makes it possible to recover distributional records for a given family, genus, or species. For this study, global searches were made on families and genera which have been identified in the southern New Zealand Miocene. However, taxa that are endemic to New Zealand or New Caledonia are not included here as their temperature ranges are likely to be artificially attenuated by the limits of the landmass. For instance Phormium is restricted to the latitudinal range of New Zealand (to a MAT of about 16°C) but almost certainly could extend further north if land existed. Similarly, taxa such as Paracryphia, Phelline, Amphorogyne, which are currently restricted to New Caledonia (but occurred in the New Zealand Miocene, Pole, 2010a) are likely to have much broader potential ranges. For a slightly different reason, Griselinia is also not included. The genus has a highly disjunct distribution between New Zealand and several locations in South America. Data records are so few for the Brazilian occurrences that a 0.98 percentile cutoff excludes them and Griselinia would appear as comprehensively cool-temperate. An example of an ideal taxon for co-existence analysis, present in the New Zealand Miocene (Pole, 2007a) is Endiandra. This genus of Lauraceae has many species, and it is widespread over several landmasses. Its distinct southern boundary, within a landmass, is likely to represent a “true” climatic limitation.
GBIF records of taxon distribution (data source acknowledgements are presented as Appendix 8) were collated in Microsoft Excel, then imported into a freely available GIS programme - DIVA-GIS, and then cleaned for geographical errors (locations in mid-ocean, or in countries where they do not exist naturally, and cultivated specimens). Once inside DIVA-GIS, the data were overlain with a climate grid, Worldclim version 1.4, 2.5 minute grid (Hijmans et al., 2005), that includes a variety of climate data and the ability to illustrate the percentile range of the data. All recent temperatures cited in this paper, unless otherwise indicated, are based on the Hijmans et al. (2005) grid.
The 0.02-0.98 percentile limits were used as the basis of climatic envelopes. Adopting tighter limits probably eliminates ‘good’ records, for example, near a taxon’s limit: those tropical taxa that extend to higher altitude ‘cloud forest’ localities (being mountain peaks, they cover relatively small areas) and it is just these areas which have been suggested as the closest analogue of higher latitude, but low altitude, Cenozoic climates. Even using a broad (0.02-0.98) percentile range the results need to be considered cautiously. For example, Arecaceae grow to nearly 10°C MAT in New Zealand today but their 0.98 limit is closer to 12°C. If Arecaceae was the critical taxon used to narrow paleoclimate in a fossil assemblage, it would result in an overestimate of MAT. But despite the apparent absurdity, in most cases it could be assumed that taxa in a fossil assemblage are not at the limits of their ranges.
The Co-existence approach as used here is mainly limited to the early to earliest middle Miocene, which has the most identified taxa. The palynological composition of middle Miocene assemblages mainly reflects extinction of taxa that ranged through the early Miocene, probably in most cases the more warmth-demanding taxa. This seems to have left taxa that are more cosmopolitan in their range of MAT and with poor utility for CA. However, some potentially useful vertebrate taxa have been identified (e.g., Worthy et al., 2007), and their MAT ranges are perhaps the best proxies for this period. Late Miocene palynology and leaf macrofossil assemblages are relatively poor in diversity, rarely published, and in some cases may be at least in part Pliocene. For this study, the modern climatic ranges of a range of taxa found as fossils in the New Zealand Miocene are compared (some taxa with very broad and generally uninformative ranges are excluded). In many cases identifications are only to family level, but even these may still hold valuable climatic data. For example, Punyasena (2008) has shown that where family spatial distribution data are adequate (in this case, in the Amazon) they can “potentially be used to reconstruct paleoclimate.”. Therefore, the basic method of Sluiter et al. (1995) is feasible even for family-level datasets.
There has been little published documentation of New Zealand’s Miocene palynology at the level of samples, but summaries (e.g., Pocknall and Mildenhall, 1984; Mildenhall and Pocknall, 1989) make it clear that most taxa have broad stratigraphic ranges, even if they make only scattered appearances in palynological samples. Thus it seems both necessary and warranted to consider taxa identified from the Gore Lignite Measures and Manuherikia Group taxa as members of a broader flora.
There is often an implication that MAT is a causal factor in plant distribution, although ecologists have long been aware of its shortcomings. Temperature factors that are more likely to be important include the annual cumulative sum of heat, or critical minimum temperatures (e.g., Box, 1981; Sakai et al., 1981; Woodward and Williams, 1987; Woodward, 1992; Woodward et al., 2004). For example, a location that has very hot summers, but very cold winters, may have the same MAT as a location with more equable conditions. Kira (1977) suggested that a Warmth Index was more meaningful. His index was the sum of monthly temperatures greater than 5°C. Essentially this was a measure of the cumulative amount of solar energy useful for growth. In the current paper, a Warmth Index is calculated - Growing Degree Months (GDM). This is the sum of mean monthly averages for months that are above 10°C (A minimum of 10°C in the summer months appears to determine the tree line in many locations, e.g., Wardle (1965), so this figure would seem to have some real significance). Similar to the process for MAT, the range of GDM for taxa represented in the New Zealand Miocene is calculated using GBIF data. One further variable likely to control plant range, the Minimum Temperature of the Coldest Month, is likewise calculated.
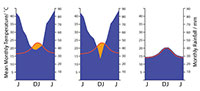
There has been a long history of trying to derive measures of moisture availability that are meaningful in terms of plant growth. But as these incorporate more and more variables - seasonal rainfall, evaporative power, soil moisture capacity among other factors - they become too complicated for the broader needs of paleobotany. I suggest here one method that can be simply related to the easily obtainable climate data of Worldclim 1.4 and the well-known “Klimadiagramme” of Walter and Lieth (1967) as graphical means of summarizing the annual variation of temperature and rainfall in any locality. It does not attempt to derive a rainfall total - but only indicate if rainfall may have been “everwet” or had an element of seasonality. The key insight of the “Klimadiagrams” approach (Walther and Lieth, 1967) was that each 1°C of MAT over a month was approximately enough to evaporate 2 mm of rainfall. If monthly rainfall and temperature were plotted on the same graph, such that 1°C was equivalent to 2 mm of rainfall (or 10°C to 20 mm), then periods of approximate rainfall deficit could be recognized. In the current paper, the area of rainfall deficit is calculated for each plant occurrence. If the rainfall curve never dips below the temperature curve the climate was essentially perhumid, with no significant dry periods, water was not limiting, it was simply “everwet.” Excess rainfall above this level is simply ‘runoff’ and is likely not registered in any quantitative sense by a plant (although other implications of excessive rainfall, such as decrease in sunshine and rapid leaching of soil nutrients become important). 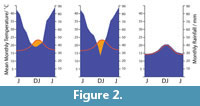 When the rainfall curve dips below the temperature curve there is a deficit and it is considered a period of drought (Figure 2). The moisture index that is used in this report is the total monthly deficit. It identifies those taxa that are essentially restricted to everwet climates. For those that range into climates with a degree of dryness, it will give an indication of the magnitude of the annual precipitation deficit, but it will not discriminate between a long mild dry period and a short extreme one. It is probably more realistic to determine what taxa are broadly limited to an everwet environment, or can tolerate some drought, than to derive some essentially meaningless measure of total annual precipitation. The method is only approximate and no doubt most prone to error in marginal situations. As an example, the conifer Dacrycarpusdacrydioides is one of the three driest-ranging conifers in New Zealand today. At the resolution of the Klimadiagram, one of its driest locations today, Deans Bush, near Christchurch, is indicated as perhumid (although the MAT and MAP curves come within about 5 mm of each other on the MAP scale). However, if this location is plotted on the Land Environment New Zealand Annual Water Deficit map (Leathwick et al., 2002), the much higher complexity of this dataset shows Deans Bush is actually an area with a total annual rainfall deficit of over 200 mm. This dry location falls outside the 0.02-0.98 percentile range of the species, although it is highly likely that before human-induced deforestation by fire affected the driest areas of New Zealand, this species would have extended to even drier areas.
Climate from Nearest Living Relatives (NLR)
At this stage, application of the NLR method to the New Zealand record, at least in the sense of Mosbrugger and Utescher (1997), is not practical as the level of taxonomic precision simply has not developed. However, a few fossils do show a close morphological similarity to an extant species. In these cases the opportunity is taken to point them out and consider the climatic implications.
Climate from Foliar Physiognomy
The evidence from leaf size and morphology (particularly the margin type) has become a key technique for determining paleoclimate from plant fossils. This began with Bailey and Sinnott’s (1916) observation that the proportion of toothed versus smooth (entire) leaf margin of floras correlated with temperature. Wolfe (1979) quantified this univariate relationship for forests of eastern Asia and the technique has become known as Leaf Margin Analysis (LMA). Wolfe (1993) later proposed that a multivariate approach, where many leaf attributes were recorded, was more accurate and could be used to determine many more aspects of paleoclimate than simply mean annual temperature, but in contrast, Wilf (1997) maintained that a univariate approach was more accurate. The obvious appeal of the physiognomic methods is the ‘plug and play” simplicity, where relatively easy to obtain data provide impressive results. Even the multivariate CLAMP method, thanks to the efforts of R. Spicer, can now be carried out online (clamp.ibcas.ac.cn/Clampset2.html; Yang et al., 2011).
Foliar physiognomic techniques have resulted in the somewhat routine reporting of very precise MAT (results presented to the tenth of a degree) along with Mean Annual or Growing Season Precipitation (to the millimeter) values for fossil assemblages. In a growing list of cases these come with a cavalier attitude to the taxonomy that forms the basis of the results. As Australasian examples, Kennedy (2003) reported results from Late Cretaceous-Paleocene assemblages said to contain up to 58 dicotyledonous taxa - but the justification for the extraordinary number of taxa remains unpublished. My impression is that perhaps 5-8 taxa are able to be distinguished in the richest assemblage. This would not only make a significant difference to the climate results, it would make it entirely unsuitable for the method. Greenwood et al. (2003) gave physiognomic results for seven Australian Paleogene assemblages. Only one of these (Nerriga, from Hill, 1982) has had the full taxonomic complement published. Most recently Reichgelt et al. (2013) have given climate estimates for Foulden Maar. One of their CLAMP results was restricted to “taxonomically identified” leaves. At least eight of the 23 taxa they listed have never been documented. In addition, there are six Lauraceae taxa that were described only as Laurophyllum in Bannister et al. (2012), yet in the more recent study are all in extant genera with no explanation. The other CLAMP result was based on all leaves in a collection, for which no grounds were given for defining the taxa beyond some sketches. Their taxonomic overlap method involves 36 taxa that are claimed to have been recovered from Foulden Maar as macrofossils. About half of these are not based on any documentation at all, whilst for others the first records from Foulden Maar were described by Pole (1996, 2010b), but these papers were not cited. A further 28 taxa are said to be known from pollen records only, of which 19 remain undocumented and are presumably to be found in their reference to ‘Mildenhall et al. in prep’. It is a sad situation where the bulk of a paper relies on unpublished work, and at the same time, ignores what has been published. Their conclusions will not be discussed here.
The most recent development in foliar physiognomic analysis has been termed ‘digital leaf physiognomy’ (Royer et al., 2005; Peppe et al., 2011). This method uses digitized fossil leaf outlines (i.e., shape) as the primary data and claims superior results over the earlier quantized recording of leaves.
There has been considerable debate on the accuracy of the foliar physiognomic methods, mostly concerning estimates of MAT. Initially Wolfe (1971) suggested that a precision of ±5% could be achieved if a leaf margin proportion was based on > 29 species, reducing to ±10% for 20-29 species. More recent work has found that somewhat different relationships between leaf margin proportion and climate apply in different parts of the globe (e.g., Greenwood et al., 2004), and in different habitats (e.g., Burnham et al., 2001). In addition, these relationships are mostly based on whole floras (derived from a total species list for a given area), not based on leaf-litter, which is heavily biased towards the canopy species, including lianes (Burnham, 1989). There has been some investigation of whether litter physiognomy reflects the canopy; Greenwood (2005) and Dilcher et al. (2009) reported on studies where MAT estimates from leaf litter and canopy floristics are not significantly different, but the general assumption that it does remains close to an act of faith. There are many sources where error can accumulate in the method (e.g., Greenwood, 2005; Green, 2006). For example, despite being the key character involved, little distinction is made between the sizes of leaf teeth. The teeth of many New Zealand plants today, as in the Miocene, were small, but in some calculations of climate from leaf physiognomy they are given equal weighting with much larger teeth.
On top of this there are more fundamental criticisms. Jordan (1997a) pointed out that some climatic criteria predicted by the methods, for instance rainfall, are not independently derived from the physiognomy, but result from the particular correlation with MAT today. Nevertheless, workers continue to publish estimates of Mean Annual Precipitation, in some cases to the millimeter. Such figures are meaningless for plant distribution if rainfall is seasonal, and rainfall cannot be independent of temperature/evaporation. It is difficult to see how plants could record rainfall above that which produced a saturated soil. For this reason, rainfall “totals” as produced by the CLAMP method are ignored here.
It is clear now that the relationship between MAT and leaf margin is somewhat different in different areas of the globe and that this reflects different floristic compositions (e.g., Stranks and England, 1997). Perhaps the most important criticism here has come from Little et al. (2010), who concluded that there is a significant phylogenic effect in the foliar physiognomic signal. They basically argued that the leaf physiognomic method does not work, except perhaps for documenting qualitative change in very well-studied areas. They point out that the differences in the relationship between leaf margin and MAT around the world - sometimes >5°C, is likely to be an indication of the uncertainties of the method. Similarly, Peppe et al. (2011) concluded that the standard error associated with a “globally derived leaf-margin analysis equation is at least ± 4°C.” In addition, Green (2006) gave a thorough analysis of the many errors of the physiognomic methods, in particular noting the unrealistic practice of giving the binomial sampling error as the main error. Royer (2012) concluded a minimum error in MAT for the methods used here (not including digital leaf physiognomy) as ± 5°C, with the exception of closely spaced (in time and place) assemblages, where the error may be “closer to ± 2°C.”
For the current work, MAT results are presented for both on the univariate LMA method and the multivariate CLAMP as produced by the online method (Spicer’s CLAMP website) using the Physg3brcAZ (non-cold) calibration set and the GRIDMET3brcAZ meteorological file. For LMA the Australian relationship of Greenwood et al. (2004) is the one most likely to be relevant to Miocene New Zealand, but it will not be “the correct” relationship, as the floristics of New Zealand in the Miocene involve taxa that are not now found in either Australia or New Zealand. For both methods the results are given with an indicated error of 5°C. ‘Digital leaf physiognomy’ (Royer et al., 2005, Peppe et al., 2011) is not attempted here as the relevant equations are not readily available and because many of the fossil taxa are probably too fragmentary for it to be very useful in this case.
The physiognomic methods rely both on reasonably complete taxonomic partitioning of fossil assemblages and reasonable levels of diversity. However, even the most diverse fossil assemblages in New Zealand so far are still rather species poor. In addition to those fossil leaf taxa already described from Foulden Maar and the Manuherikia Group by Pole (1992a, 1992b, 1992c, 1993b, 1993c, 1993d, 1993e, 1993f, 1993g, 2007a) and Pole et al. (1989, 2008) some other taxa need to be described to be included in the present study. These are typically ones that are uncommon and/or poorly preserved, but nevertheless need to be dealt with for foliar physiognomic completeness (Appendix 4).
The result is that only two assemblages have more than 20 taxa and can therefore justify having physiognomic techniques applied to them. These are the Foulden Maar and Bannockburn-03. However, by combining some assemblages, the total can be raised and the results may indicate a broader climate, or a point through which a changing climate may have moved. It also gives some indication on how robust the results are. In this paper, results are also given for a combination of the three main Bannockburn assemblages and also for Bannockburn-03 plus the Nevis. These two assemblages both come from the Nevis Oil Shale or what may be distal equivalents (Douglas, 1986). Due to the virtual absence of leaf fossils from the middle Miocene, the foliar physiognomic approach is not yet feasible for that time, and while leaf assemblages are present in the late Miocene, the low biodiversity also means that taxon-based foliar physiognomy is not warranted.
Climate from Average Leaf Size
A relationship between the average leaf size (all leaves) of the canopy, or leaf litter, and climate has long been known. For example, in Australia, average angiosperm leaf size was (and is) used as a major criteria for classifying rainforests (Webb, 1959), with broadly tropical or megathermal forests being dominated by mesophyllous leaves, subtropical or mesothermal forests dominated by notophyllous leaves, and temperate or microthermal forests being dominated by microphyllous leaves. Relatively warm but seasonally dry forests had smaller leaves than everwet ones. Greenwood (1992, figure 18) quantified this relationship for a range of well-documented Australian rainforest sites. Carpenter et al. (1994, 2012) further illustrated this relationship for another dataset of leaf litter samples from rainforest sites in Australia, although sample details were not published. Neither provided an estimate of uncertainty, but these results have a standard error of the regression of about ± 1.7°C. As an error for predicting MAT for fossil assemblages, this will be unrealistically small, because it is based on a limited area and taxonomic composition. A more accurate estimate of the error is beyond the scope of this work, but a minimal error of ±2°C will be indicated. Some further leaf litter data for New Zealand and Australia are presented in Appendix 9.
Dilcher (1973), Jacobs (1999), and Dutra (2007) further clarified the response of leaf size to climate. If rainfall is not limiting (i.e., in rainforests), leaf size tends to respond to temperature. But when temperature is not limiting (i.e., warm climates), changes in leaf size mostly reflect rainfall. Additionally, it is known that when soil nutrients are strongly limiting, leaf size tends to be reduced, for example this has been noted in the very low-nutrient ‘heidewald’ forests of Borneo (Bruenig, 1990). However, Peppe et al. (2011) and Royer (2012) claim only a weak global correlation of MAT with leaf size, pointing more to a correlation with MAP. But it is important to realize their sampling involved a variety of techniques, including selecting several leaves from a variety of species, not simply a sample of leaf-litter, and it was global - across a wide variety of vegetation types. Royer (2012) commented that the “overall relationship between MAT and leaf size is weak”... “except in Australasia.” This misses a point: Australasia is unlikely to be unique. The correlation in Australia is only for what Australians term “rainforest” (vegetation where fire is not an integral part of the ecology; Bowman, 2000) where moisture is not limiting (seasonally dry rainforests have smaller leaves). Within what can be reasonably inferred to be such vegetation, average leaf size may well be one of the best techniques available. The lack of need for any taxonomic partitioning in a method that relies on average leaf size will appeal to some workers. More research needs to be done in this field.
A recent proposal to determine MAT from the size of Podocarpus leaves (Carpenter et al., 2012) broke new ground on the claimed potential of physiognomic methods. The authors quantified a global relationship between the midpoints of the leaf area of extant Podocarpus species and the midpoints of their MAT distribution. They demonstrated its use by taking a single undescribed Eocene leaf fragment, claimed to be Podocarpus, width known, length unknown, estimated the length, and thence the area, and arrived at a MAT with a standard error of 3.3°C. However, their standard error only applies to the scatter of the midpoints. To use the equation predictively and claim this accuracy is fallacious. Appendix 10 illustrates the spread of MAT for extant species of Podocarpus from which Carpenter et al. (2012) obtained midpoints - some 17% of species have a MAT range of >10°C, even at the 0.98 percentile range. A true dataset of Podocarpus size and MAT is well beyond the scope of this paper, but a more realistic use of Podocarpus leaf size would limit it to a broad comparison with similar-sized extant species - essentially the NLR approach.
It has been claimed that taphonomic processes may significantly alter the leaf size signature between the source vegetation and its deposition. It is highly likely for example, that transport might fragment the largest and often thinnest leaves in litter, although whether this simply truncates the ‘tail’ of the leaf size distribution histogram, leaving the mode unchanged, remains to be tested. A more important claim was made by Greenwood (1992) that in Australian rainforests there was a significant decrease in average leaf size between the canopy and the litter directly below, and that this was the result of some kind of taphonomic process. This discrepancy was serious enough that, for example, a “mesophyll dominated” forest “has produced notophyll-dominated litter” (Greenwood, 1992, p. 170). However, these conclusions stem from Webb (1959, table 1) where the broad ranges of average leaf sizes for different Australian forest classes were reported. Although Greenwood (1992) stressed his assertion (p. 163) that these were values for “direct sampling of the canopy,” no clear details were given by Webb (1959) regarding location or specific collection methodology for these figures. There is no evidence that Webb actually quantitatively sampled the rainforest canopy directly - this would be difficult enough to do today, let alone in 1959. Webb (1959, p. 555) stated that his table 1 was for “actual leaf counts, on a percentage basis, for species and individuals.” However, he also stated (Webb, 1959, p.557) that “data are based on ‘spot listing’ and quadrats.” It seems more likely that Webb was expressing the number/percentage of individual trees in a quadrat with a typical leaf size, not individual leaves. With respect to the Webb nomenclature of Australian rainforests, Greenwood (1992) wrote (p. 151) “The prevailing leaf size of the canopy leaves is indicated in the designated name of each of the forest types. In practice, each forest type can be identified solely by the relative dominance of the canopy by mesophyllous, notophyllous (sensu Webb, 1959), or microphyllous species or individual trees (Webb, 1959; Tracey, 1982).” This is incorrect, as Webb himself stated (p. 556) that if “two adjacent leaf classes are most common ... In naming the subformation, the larger leaf size is taken, e.g., Mesophyll vine forest, for meso-noto sizes.” This is not saying one size class prevails or is dominant. This was reiterated in his table 1 where Simple Notophyll Vine Forest could have up to 70% of microphyllous ‘individuals’.
Christophel and Gordon (2004) later speculated that the canopy-litter difference was not taphonomic, but a result of (p. 329) “‘compositional’ bias - for example, the litter being composed of more life forms.” As Greenwood clarified (2005, p. 502) this refers to “the scoring of both tree and non-tree leaves (particularly woody vines) in the litter, but the scoring of solely tree leaves in the canopy samples.” It is unclear why this would result in a smaller leaf size signature, particularly as Webb (1959, p. 556) recommended excluding shade leaves and vine species that he thought would give a larger signature.
The simple explanation to this supposed problem is that there is no strange taphonomic process acting between canopy and litter, only that the measurement techniques were different. This does have some consequences that will need to be addressed in future research. Essentially, it seems likely that large areas of Australian rainforest that are routinely mapped, as say, Notophyll Vine Forest, are in detail, microphyllous. For paleobotany it means that a leaf assemblage dominated by microphyllous leaves, but with a notophyll component might be called a ‘Notophyll’ forest if it were growing in Australia today.
For the current work, leaf length and width was measured for the most specimen-rich Miocene fossil leaf assemblages. To add to the database of extant leaf litter (primarily Greenwood, 1992) four extant leaf litter samples in New Zealand and Australia were also recorded. These samples were taken from areas regarded as mature and relatively undisturbed rainforest (for example, not overwhelmed by lianes), the litter was softened in hot water, and all reasonably intact leaves were extracted, pressed, numbered, and measured. Samples typically had 200-300 leaves. The primary measurement data are summarized as histograms, along with Cain and Castro’s (1959) 0.667x length x width equation for a rough estimate of leaf area from which the Raunkier-Webb leaf size classes can be determined.
The practical issues of measuring leaf size are rarely, if ever mentioned. The main problem is that leaves in a fossil assemblage are commonly missing their tips (if not entirely fragmentary). For this reason, some amount of estimate is often needed. Leaves that are more than about 10% fragmented are ignored. For the rest, as data are subsequently grouped into broad bins in the histograms, any errors in estimation are unlikely to substantially alter the resulting pattern.
Climate from Biodiversity
In general, warmer and wetter forests tend to be more diverse (more species per unit area) than cooler or drier ones (e.g., for angiosperm diversity, see: Francis and Currie, 2003). Other factors such as soil nutrient, fire and even carbon dioxide content (Royer and Chernoff, 2013) may confound these effects. An important contribution by Burnham (1989) and Burnham et al. (1992) was quantifying the relationship between the proportion of leaf area in the litter on a forest floor, and the proportion of the basal area of trees in the forest for a particular taxon. This means that if leaves in an assemblage are of broadly comparable size, then they can be considered as broadly proportional to the numbers of trees in the original forest. It follows that very biodiverse forests will produce litter in which there is a low ratio between numbers of leaves in a sample and the number of species represented. In a typical sample of leaf litter from a relatively diverse forest, most taxa will be represented by only a few leaves, and probably some by only one leaf. In forests of low diversity, most leaves will be of only one species. Although this particular aspect of ecology has had little work done to quantify this relationship, the relationship between number of taxa and number of leaves in a sample appears to be similar to the better-known species-area curve, that is, it approximates a log-normal curve (Rosenzweig, 1995). The utility of this is that the biodiversity of leaf assemblages with different numbers of leaves can be compared by plotting them on log-log graphs. In biodiverse assemblages, the number of taxa represented will rise rapidly compared to poorly diverse assemblages. They will be represented by points lying on steeper lines through the graph origin. The results will allow the biodiversity of fossil assemblages to be compared with extant assemblages, and possibly some qualitative estimates made of climate.
In theory all that is needed is the number of species in an assemblage and the number of specimens used to arrive at that figure. In practice, there are several issues, not the least arriving at a credible taxonomic partitioning. In the assemblages studied here, the most pertinent problems are dealing with fragmentary leaves, particularly ones where weathering has removed finer detail. There will be some tendency to include fragmentary specimens that have characters that make them easily identifiable, and one to reject more generalised (simple, entire-margined) taxa. There is no simple solution to this, but it is recognized that the number of taxa is likely to be something of an underestimate.
RESULTS
Early-earliest Middle Miocene
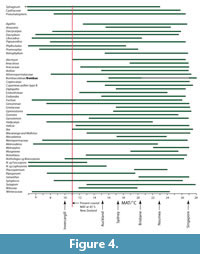
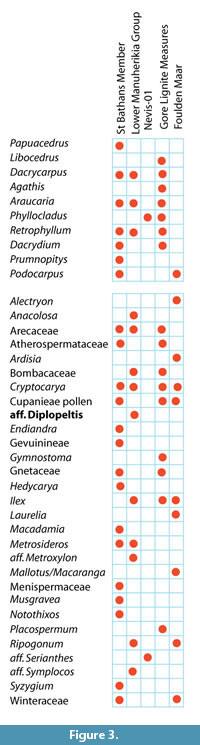 Climate from Coexistence Data. The distribution of important, or more restricted taxa, is shown in Figure 3. The range of MATs (Figure 4) shows that, at the 0.98 percentile level, there are several taxa that have current MAT ranges in excess of that at 45°S in New Zealand today. Taxa that are widespread today and that can be most confidently regarded as existing across the potential of their MAT range include Arecaceae, with a minimum MAT of about 12°C, Ardisia and Endiandra , with minimum MATs of around 15°C, Sapindaceae Cupanieae type B and Retrophyllum with slightly warmer minimum MATS of about 15.5°C, and Gymnostoma with a minimum MAT of nearly 18°C. Beyond this there are taxa that appear to have higher MAT requirements, but which I would be more hesitant to accept at face value. Placospermum has a minimum MAT of about 19.5°C, but has a very restricted geographic range today. Both Gnetum and Musgravea have similar minimum MATs, but Gnetum itself has not been identified, only a somewhat similar extinct taxon. Serianthes, at about 20.5°C, is a possible identification only (Pole et al., 1989), as is Metroxylon, at more than 23°C. Bombax, which is known from pollen throughout the early Miocene (Couper, 1960a; Pocknall and Mildenhall, 1984), has perhaps the warmest minimum MAT based on a well-documented identification about 20.5°C.
Some taxa can also be used to suggest an upper limit to MAT. For example Nothofagus subgenera Fuscospora ranges up to about 13°C and Lophozonia about 17°C. However, these upper MAT limits, particularly of N. s.g. Fuscospora, are difficult to reconcile with other data. Explaining them away by “upland” vegetation is difficult for the periods when New Zealand was most subdued. It suggests that perhaps there is an identification issue, and/or with a basic premise of the cooexisting MAT methodology. Beyond these, Phyllocladus suggests a maximum MAT of about 18.5°C, Ripogonum a maximum of about 20°C, Libocedrus 20.5°C, and Metrosideros a maximum of about 23°C. Although the same issues will apply to these taxa, these ranges suggest more robust ‘caps’ to MAT in the assemblages in which they are present.
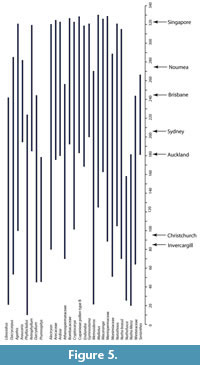
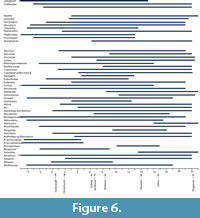
 The geographic ranges of “Growing Degree Months” (Figure 5) are broadly similar to MAT, and also show that there are several taxa that require more warmth than today. The ranges of the Minimum Temperature of the Coldest Month (Figure 6) suggest figures that were three or four degrees higher than today. The likelihood of any freezing would have been considerably reduced.
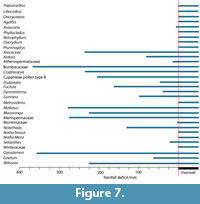
 According to the rather crude assumptions in the ‘Klimadiagramme’ (Figure 7), basically all taxa are consistent with a perhumid, or everwet climate, though a few taxa can cope with some dry periods. Diplopeltis is the only taxon that does not exist in a perhumid climate in any part of its range today. It may be that the pollen attributed to this genus, is more likely in another, perhaps extinct genus, of the Sapindaceae.
Climate from Nearest-Living Relative. The size of the fossil Podocarpus alwyniae from St. Bathans is at the smallest end of the range of leaf size midpoint (c. 40 mm2) for the genus today. Although such small-leaved Podocarpus are typical of cool climates, such as New Zealand and southern Australia today, in other parts of the world they are found in much warmer climates. For example, P. rostratus, with a midpoint area of 34 mm2, has a MAT ranging up to 24°C. However, a larger leaved species of Podocarpus, P. sp. ‘Mata Creek’ occur in some Manuherikia Group assemblages. The length is not preserved in any specimen, but widths of 9.0 mm may have been achieved (Pole, 2007b). As a nearby analogue, this is broadly comparable to P. elatus currently growing on the east coast of Australia. In the Foulden Maar assemblage, P. travisiae has lengths around 110-140 mm and widths of 7-13 mm (a midpoint area of about 1250 mm2). The closest extant species of similar size is P. smithii in Australia growing under a MAT of about 20-23°C. Despite the presence of these large-leafed Podocarpus, they may not be indicative of significantly warmer MATs than today. For example, P. laubenfelsii, with a leaf-size midpoint of 1820 mm2, grows in MATs down to 11°C. It may well be that individuals growing at this MAT extreme have leaves that are smaller than P. travisiae, but based on the available data set of Farjon (2010) this is not possible to determine and is a subject for future research. Podocarpus leaf size, whilst suggestive of MAT, is not yet understood well enough to give reliable results.
 Amongst the angiosperms there are taxa that are significantly larger than their relatives in New Zealand today. For example, the fossils described by Pole (1993e) as MANU-5 - ‘ Elaeocarpus/Sloanea’ I now regard as clearly Elaeocarpus. The leaf shape, marginal hairs, domatia, and broad size indicate an Elaeocarpus allied to species such as E. costatus (Lord Howe Island) and E. culminicola, E. elliffii , E. foveolatus, E. grahamii, and E. ruminatus, of the Australian mainland, which grow in MAT range of about 17-27°C. Likewise, a fossil Lauraceae, MANU-3 (Pole, 1993f), can be compared to several Cryptocarya species now growing in Australia and New Caledonia; C. velutinosa, C. macrocarpa, C. putida, C. rhodosperma, C. onoprienkoana , C. oblata, C. mackinnoniana, and C. murrayi. Grouping these species in the GBIF database indicates a MAT (0.92 percentile) of about 19-25°C. FOLD-3 is almost certainly an Ardisia, similar to A. pachyrrachis and A. solanacea of Australia, also covering a MAT of about 19-25°C.
The fossil Nothofagus azureus, from the St Bathans Member, reaches 87 mm long (Pole, 1993c). This size is comparable with the largest Nothofagus extant in South America, N. alessandrii, N. alpina, and N. glauca, all of which are deciduous (Romero, 1980). Despite excellent preservation of other cuticle in the type locality, good cuticle preparations have not been achieved with N. azureus, indicating very thin cuticle, and thus a leaf with a short lifespan, also suggesting it may have been deciduous. The extant species, emphasizing the Nothofagus problem, occur across a MAT of 4-14°C.
 Climate from Foliar Physiognomy. Data for assemblages amenable to foliar physiognomy are presented in Table 1 and Table 2. Univariate equations for modern Australian rainforests (Greenwood et al., 2004) suggest a MAT in the range of 12-25°C, the Steart et al. (2010) dataset for South Africa suggests a slightly warmer values of 16-29°C, whilst the East Asian dataset of Wolfe (1979), calculated according to Wing and Greenwood (1993), gives even higher values of 18-32°C. In light of the criticisms of Little et al. (2010) on the phylogenetic component in these results, the most applicable equation for the New Zealand early Miocene (to the degree the method works at all) is for current Australian rainforests. Thus the cooler results are more likely than the warmer ones.
The multivariate CLAMP results give the highest MAT for the Foulden Maar, (17-27°C) and the only Bannockburn assemblage with sufficient species, Bannockburn-03, gives a MAT of 13-23°C. A combination of the main Bannockburn assemblages (Bannockburn-02,03,04) gives a similar result of 12-22°C, and combining Bannockburn assemblage Bannockburn-03 and Nevis assemblages 09-17 (both are from the Nevis Oil Shale or a distal extension) again gives a comparable MAT of 13-23°C.
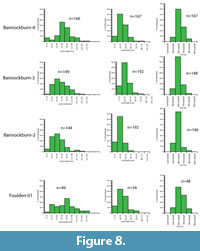 Climate from average leaf length. Mean Annual Temperatures derived from the Greenwood (1992) and Carpenter et al. (2012) average leaf length equations are given in Table 3 and Table 4, based on the simple average leaf length of assemblages. In addition, the histograms of leaf length, width, for fossil assemblages are given in Figure 8 and Figure 9. For comparison, equivalent histograms for four extant litter sites are given in Figure 10.
Climate from Biodiversity. The five assemblages that were tabulated (Figure 11) for number of taxa and number of specimens all lie on a much steeper slope than relatively cool rainforest floras of Australia or New Zealand today. They rank with recent leaf litter collections from Australian locations with MATs from 17.1°C (Minamurra) to 24.9°C (Noah Ck).
Middle Miocene Casuarinaceae and Chenopodicaeae Zones
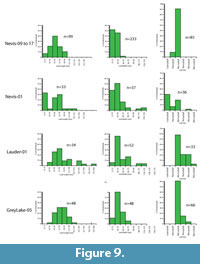 Potential paleoclimate proxies from this level are mostly restricted to vertebrates and pollen. The MAT ranges of some potentially useful vertebrate taxa are indicated in Figure 12, along with the Arecaceae, a group notable for its absence in this time slot. Leaf macrofossils are almost entirely restricted very rare Nothofagus from this stratigraphic level. Continuing work on the charcoal component of the Casuarinaceae Zone has revealed charred grass cuticle (Figure 13), the first evidence of this in New Zealand.
Middle-late Miocene
Quantitative data for this time are based on the Kaikorai Valley assemblage collected by J.D. Campbell (Campbell, 1985; Pole, 1993h). Mean Annual Temperatures derived from the Greenwood (1992) and Carpenter et al. (2012) average leaf length equations are given in Table 5 and leaf length, width, and size histograms are given as Figure 14. A range of Nothofagus leaves from other, mostly unpublished, locations is given in Figure 15. None of these assemblages has enough taxa for a foliar physiognomic approach.
DISCUSSION
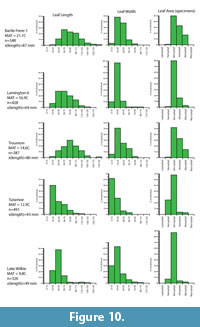 Early Miocene-earliest Middle Miocene
The range of early-earliest middle Miocene MAT estimates (Figure 16) spread across about 17°C. The LMA and CLAMP techniques produce broadly similar midpoints, but those based on leaf length consistently tend to be slightly cooler. The midpoints of all foliar physiognomic estimates tend to be around 17-18°C. The taxonomically based co-existence approach produces similar results. The minima and maxima suggested by taxa that are regarded as being ‘most reliable’ suggest MATs of 15-22°C. The estimates from the few taxa that have comparable extant relatives (17-27°C) suggest the upper parts of this range are credible. Within the limits of accuracy it is not clear that any one assemblage is warmer or cooler. Average leaf length in Foulden Maar is significantly larger than Bannockburn-02 (p = 0.05) and for a ± 2°C level of accuracy this suggests Foulden was significantly warmer. However, if the real accuracy of the leaf length method turns out to be closer to ±3°C, this significance disappears. Furthermore, MAT from Bannockburn-02 is only based on leaf length, as its species diversity is too small to apply CLAMP or LMA (although this in itself may suggest cooler conditions). However, it is combined with other nearby small-leafed assemblages to raise the diversity, and the CLAMP/LMA results are not significantly different from Foulden Maar.
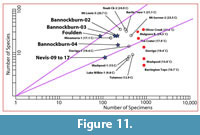 Foulden Maar most likely had a MAT in the 16-24°C range. There was seasonality to the climate, as indicated by the “varves” in the Foulden Maar diatomite (Lindqvist and Lee, 2009). However, there is no convincing evidence that this seasonality extended to drought. Although there have been several statements that Macaranga/Mallotus indicate dry or seasonally dry conditions (Mildenhall, 1989; Lee et al., 2010), this is not the case. Both genera are very widespread ecologically, across a wide range of ‘rainforest’ types, both wet and relatively dry. The presence of Gyrostemonaceae pollen in the Foulden Diatomite has also been used as evidence that the climate was (Bannister et al., 2005, p. 515) “dry, warm temperate to subtropical,” or (p.523) with “at least seasonally dry periods.” However, this conclusion disregards all the other proxies in the assemblage which point to an everwet environment. Today only one species in the Gyrostemonaceae, Codonocarpus attenuates, is found in marginal rainforest and the rest are restricted to arid environments. The presence of Gyrostemonaceae in obviously high rainfall environments is probably another example of what
 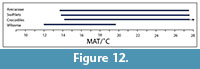 was documented by Crisp et al. (2004) for Australia - mid Cenozoic radiation of rainforest taxa into arid areas, and either stagnation, or perhaps extinction of the original rainforest taxa. The lack of epiphyllous fungi has also been cited as supporting evidence for a dry climate at the Foulden Maar (Bannister et al., 2006). The ecological distribution of epiphyllous fungi was documented by Lange (1976, 1978), who proposed that their variety in the fossil record could be used as indicators of wetness. This seems well-supported, but their apparent complete absence in the face of all other evidence suggests epiphyllous fungi can only be used in a positive sense.
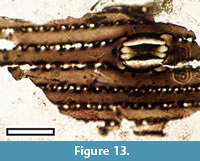 The range of MATs indicated for the lower Manuherikia Group is similar to Foulden Maar. Foliar physiognomy suggests MATs of about 17-19°C, whilst leaf length suggest MAT may have been as low as 12°C in the coolest assemblages, but ranged up to about 17°C. The MAT minima and maxima of around 15-20°C that are suggested by taxonomy, are consistent with the physiognomic data. They do suggest a careful look at the distribution of pollen of relatively cool indicators, such as Phyllocladus. The climate was also distinctly seasonal, as indicated by growth rings in wood (Evans, 1931).
In terms of the spread of leaf size (see histograms in Figure 8, Figure 9), angiosperm leaf size in the lower Manuherikia Group is consistently dominated by leaves of microphyll size (even if notophylls and mesophylls were grouped into the original Raunkiaer (1934) sense of ‘mesophyll’, microphylls would still predominate). The variation between assemblages is reflected in the spread and direction of the ‘tails’. Foulden Maar is the assemblage where the notophyll class comes closest to parity with microphylls. The simplest interpretation of this would be that Foulden Maar had the warmest climate. Lauder-01 also has a large signature, with an equal proportion of notophylls and mesophylls. At the opposite extreme, the Nevis samples lack notophylls entirely. Nanophylls are always minor, while the leptophyll class is absent - with the exception of the Nevis-01 assemblage, where they mostly consist of legume leaflets.
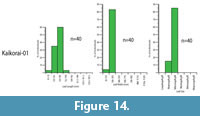 In terms of microphyll dominance, the fossil leaf-size signatures are similar to the extant New Zealand and Australian litter samples reported here (MATs ranging from 9.8 to 21.1°C). The Foulden and Lauder assemblages, with the largest leaves, compare broadly with the Trounson and Bartle-Frere-1 extant litter samples (MATs of 14.6 and 21.1°C, respectively). Direct comparison with other parts of the world is not straightforward, as leaf-size data are usually not based on leaf-litter, and in some cases do not distinguish the notophyll class. However, results from Venezuela (Schneider et al., 2003) show the dominant leaf size decreasing steadily with altitude, as expected, but with mesophylls dominant at about 14.9°C, notophylls dominant at about 13.4°C, and a mix of notophyll-microphylls dominating until outright dominance by microphylls by about 10.7°C. Thus, there is a suggestion of a larger modal leaf size for a cooler MAT in Venezuela than in Australasia. That there is a difference should not be surprising. Leaf size (including metrics such as leaf length) may show similar trends around the world with respect to MAT, but differ in detail (similar to leaf margin) due to the influence of other effects, such as energy and rainfall seasonality, and soil differences. Despite the agreement between the Greenwood (1992) and Carpenter et al. (2012) leaf length vs MAT equations, they are both based on Australian rainforest vegetation. Caution should evidently be exercised until the relationship between leaf size and climate is better understood worldwide.
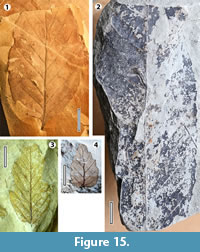 Leaf size in the lower Manuherikia Group evidently fluctuated within a relatively small range, and it is not possible to be certain of the relative influence of climate or ecology, but given the fluctuations in global climate known to have occurred in the early Miocene, differences in leaf size can at least be expected. It is clear, based largely on broader taxonomic composition, that there was significant climate change within the lower Manuherikia Group (e.g., Pole 1993a). To pick on one taxonomic group as an example, the lower Manuherikia Group has a high diversity of conifers - the St. Bathans Paleovalley contains 16 conifer species in 12 genera (Pole, 2007b). In general this suggests a relatively cool (though not cold) climate, with high rainfall. However, within New Zealand today, two groups of podocarps can be distinguished - those that typify low rainfall sites and/or richer soils (e.g., Dacrycarpus, Podocarpus and Prumnopitys ) and those of more acidic or nutrient-depleted sites with extremely high rainfall (e.g., Dacrydium ; McGlone, 1988). Pole (2007b) noted that the podocarps, which dominated most St. Bathans assemblages, were the genera (and some species) that today typify the relatively dry (everwet but without excessive rain), relatively nutrient-rich soils. This might be expected in a pre-Southern Alps landscape where the topography was not high enough to cause extremely high rainfall. Dacrydium is one of the most common trees in the New Zealand forest today, but in the St. Bathans Member it has only been found in one assemblage that was also distinct in having Papuacedrus and abundant small-leaved Podocarpus. It is also uncommon in clastic assemblages in the Gore Lignite Measures. This evidence hints that although rainfall was high, or perhaps frequent, it was not so extreme as to cause rapid leaching.
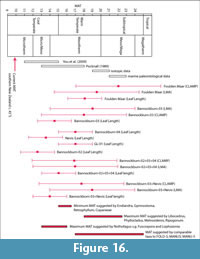 Higher in the Manuherikia Group (Fiddlers-Kawarau Members) conifer macrofossil diversity typically drops to just one or two species. In the case of Bannockburn-04, there are no known conifer macrofossils, or Nothofagus. For Bannockburn-03, containing just Araucaria and a single specimen of what is probably Retrophyllum, foliar data suggest MATs similar to the St. Bathans Paleovalley. Pole (1993a) drew an analogy with the extant Araucarian “dry rainforests” of Australia. This seasonal dryness may be the cause of the low conifer diversity.
If the diverse environments within the Southland Gore Lignite Measures are grouped, the conifer diversity is similar to the St. Bathans paleovalley. Pole (2007b) recorded six conifer species in five genera from mostly clastic material that would have accumulated between coal swamps, whilst eight species in seven genera were recorded from within lignite that would have grown on raised mires (Jordan et al., 2011).
The variation in the current results is consistent with earlier conclusions of climate change within the lower Manuherikia Group - but it emphasizes that this variation, specifically in MAT, is below the precision currently afforded by the more quantitative proxies.
The amount and variation in rainfall is much less clear. CLAMP does provide results for various aspects of rainfall, but, as argued earlier, my opinion is that rainfall beyond ‘everwet’ is unlikely to be directly recorded by foliar physiognomy. The rainfall deficit results presented in the current work (Figure 7) make it clear virtually all lower Manuherikia Group taxa are generally restricted to everwet climates. If MAT is known as well as its seasonality, Klimadiagramme can estimate the minimum annual rainfall to maintain the everwet climate. For example, if MAT were 17°C and annual variation around 3°C, and rainfall each month was just enough to balance that lost by evaporation, then the minimum annual rainfall would only need to be around 400 mm (Figure 2). In reality, this situation would be highly unlikely, and there was likely to have been a season where monthly rainfall was well in excess of evaporation.
One of the major changes that happened within the lower Manuherikia Group was a transition from a non-burning environment to one in which fire was significant (Mildenhall, 1989, Pole, 2003). Intuitively this may imply some change in the rainfall regime, and “arid” conditions have been suggested (Mildenhall, 1989). “Arid” typically describes a climate in which moisture is substantially limiting and this was clearly not the case in the lower Manuherikia Group as some of the abundant charcoal comes from prominent lignite (i.e., peat-accumulating) deposits. Fire and an everwet climate need not be a contradiction, as there are well-documented histories of fire in everwet parts of the world, western Tasmania for example, although it is difficult there to extricate the presence of humans, who were clearly sources of ignition for a very long time (Thomas, 1993). In Tasmania humans would have provided an ignition source that was less frequent in their absence - but the fact remains that despite the very high rainfall, some parts of the landscape burnt readily. The key to this is that some types of vegetation are particularly fire prone (Jackson, 1968; Mount, 1982; Bowman, 2000). Even in an everwet climate, there were likely rare periods of relative dryness where a fire, once ignited, burnt large areas and favoured the spread of fire-prone vegetation. A mixture of rainforest and fire-prone Eucalyptus vegetation appears to have been present at some times in the lower Manuherikia Group (Pole, 1993d). At times there was an abundance of Myrtaceae and Arecaceae pollen (corresponding to the Arecaceae-Myrtaceae Zone), which along with charcoal and the associated macrofossils clearly support an interpretation of extensive palm-swamp vegetation. This kind of vegetation today is a feature of warm areas where there is a distinct seasonality of rainfall, or at least of the water table. A correction can be offered to what was indicated by Pole (2003, figure 5) as seasonal drought in the Klimadiagram sense. Rather than wet versus drought seasons it may have been the difference between very wet and less wet periods - and thus still ‘everwet”. But this could still have profound influence on the vegetation if, for example, the water table was near the surface in the drier period, but flooded with standing water in the wet season. The issue of abundant palms in the New Zealand Miocene can be contrasted with their virtual absence in otherwise similar situations in Australia. This is intriguing and the reasons unknown. Perhaps rainfall was not as seasonal in Australia, or perhaps other factors of the environment were responsible (could New Zealand have had intense cyclonic activity that favoured palms?), but addressing this issue may help clarify the climate story.
Diversity levels of the leaf assemblages are comparable with some locations having MATs of 17-25°C today, but higher diversity than some locations with MATs of 10-19°C. Perhaps little more can be said than biodiversity was much higher in the early Miocene than New Zealand forests today. However, the method may have an additional benefit of suggesting instances of over-splitting of taxa. In this case the Foulden Maar assemblage (Pole, 1996) has a distinctly high diversity for the number of specimens recovered. Further work may find some of the taxa represented by single specimens may not be distinct.
Based on the plant fossil record, early-earliest middle Miocene MATs are highly likely to have reached 17-18°C, and may at times have reached 19-20°C. Evidence for anything warmer is poor. Rainfall was everwet, though this was distinctly seasonal towards the end of this period. Warmth, as measured by either MAT or GDM, was clearly higher than at 45°S today and was similar to that currently found between Sydney and Brisbane. It represents a poleward expansion of warmth of about 12-18 degrees of latitude.
These New Zealand climate estimates are comparable with the Australian results of Sluiter et al. (1995), who, as discussed earlier, arrived at a MAT of c. 18°C for the Gippsland region. However, when their results are re-evaluted using the more extensive GBIF database available today, the precision of their estimate can no longer be maintained (Appendix 11). The results of the current study are still higher for sea surface temperatures at 50°S than those modeled by You et al. (2009) for the Miocene Climate Optimum. These results are consistent with other conclusions (e.g., Krapp and Jungclaus, 2011; Goldner et al., 2013) conceding that the reduced temperature gradient recognized by proxies in the middle Miocene, cannot yet be modeled. The current results continue the disparity between the warmer temperatures suggested by marine paleontology and the cooler temperatures by vegetation. This problem might be resolved by a better understanding of what is limiting the various proxies. Vegetation on land is more likely to be limited by sporadic outbreaks of cold polar air, generating frost damage and thus tracking cooler conditions, than the more moderate sea water temperatures.
Was New Zealand Ever Tropical in the Miocene?
Despite some conclusions based on marine paleontological evidence that New Zealand reached fully tropical (>25°C, Hornibrook, 1992) or megathermal (>24°C, Nix, 1982) levels of warmth at times in the Miocene, there is no support for this from paleobotany. For leaf size, for example, Webb’s (1959) Australian forest category of Megaphyll Vine Forest is approximately restricted to the tropics. Not only are there no known fossil leaf assemblages in the New Zealand Miocene dominated by megaphyll-sized leaves, but there are none that are outright dominated by notophylls either. Martin (1992) asked if southeastern Australia, a region that was at comparable latitudes to New Zealand in the early-earliest middle Miocene, was ever tropical in the Cenozoic. She compiled a list of extant plant taxa, which were described as “tropical, mostly tropical and subtropical” by Willis (1966) and are represented by pollen (or by closely comparable pollen) in Australia’s fossil record. However, as she was well aware, few of these plant taxa are restricted to a tropical climate today. They are Ilex, Sphenostemon, Nypa, Bombax, Caesalpinia, Merrimia, Malpighiaceae, Anacolosa, Canthium, Guettarda, and Santalum. Although concluding that these contributed to evidence that southeastern Australia was “warmer and wetter” than it is today, to her the most definitive evidence was not provided by them at all, but by a dinoflagelette cyst, Polysphaeridium zobaryi. On this evidence Martin concluded that for (Martin, 1992, p. 277) “a brief interval in the early part of the Mid-Miocene, at least one part, southeastern Australia, may have had a truly tropical climate.” Thus the possibility remains that New Zealand also achieved tropical temperatures, but for periods that are below the resolution of the plant macrofossil record, and perhaps also invisible to the palynological record, as tropical-restricted taxa may not have had the opportunity to disperse to New Zealand while it was warm enough.
Middle Miocene Casuarinaceae and Chenopodicaeae Zones
Pole and Douglas (1998) and Pole (2003) argued that there was a major climatic drying associated with their Casuarinaceae and Chenopodicaeae zones. This was expressed in a change from acidic to alkaline sedimentation that favoured the preservation of bones and stromatolites (Lindqvist, 1994) over leaves, the disappearance of coal, the presence of abundant charcoal and a taxonomic shift. Such a major environmental shift most likely correlated with a significant global climate event, the major drop in temperature at about 14 Ma. This cooling event has also been correlated with a shift to drier vegetation types at different places on the globe.
The base of the Casuarinaceae Zone is marked by a significant increase in Casuarinaceae pollen (as Myricipites harrisii ). It is not possible to identify the genus, but the sustained abundance and associated evidence suggest woodland of one of the fire-tolerant genera rather than Gymnostoma. Nothofagus continues to be represented by pollen, but tends to be dominated by the ‘ fusca’ type rather than the ‘ brassii’ type. The rare Nothofagus leaves from this zone are small (ca. 20 mm long) and the only intact specimen (Figure 15.4) shows a compound-toothed margin, where small teeth are located on subdued larger teeth, or waves. This kind of margin is displayed by deciduous South American Nothofagus, for example (the smaller than the fossil) N. obliqua (Romero, 1980). If the small leaves from the Casuarinaceae Zone are representative of a broader trend, they can be compared to other places where a decrease in Nothofagus leaf size has been linked to periods of deteriorating climate; the Antarctic Peninsula (Dutra, 2004; Reguero et al., 2013) and Australia (Hill, 1983).
The base of the succeeding Asteraceae-Chenopodiaceae Zone represents the point where herb pollen rose to dominate over Nothofagus ‘ brassii’ -type pollen and suggests cool conditions. The close association of prominent Chenopodiaceae and Sphagnaceae pollen is disconcerting - typically the former indicates distinctly dry conditions and the latter wet (Pole, 2003, figure 2 indicates palynological samples with both Chenopodiaceae and Sphagnum levels reaching c. 10%). This association is likely to be highly restricted in climate-space, and therefore a critical key to the conditions of the Miocene. One place where vegetation producing such pollen spectra occur in close association today is in Patagonia (Arroyo et al., 2005), and this may be a good analogue for the Chenopodiaceae Zone - a cool climate, but with rainfall at such levels that the moisture-evaporation equation could have varied from one to the other. In Patagonia today, this is controlled by the significant variations in topography. However, there is little sedimentary evidence for much topography in the Chenopodiaceae Zone of New Zealand. Both Chenopodiaceae and Sphagnaceae occur together in the palynological spectra of peatbogs further north in the highlands of southernmost Brazil (Roth and Lorscheitter, 2008), but their prominence is not recorded.
It is not possible to precisely locate the base of the Mildenhall and Pocknall (1989) Chenopodipollis chenopodiaceoides Zone, suffice to say it will lie somewhere between the base of the Casuarinaceae Zone and the Asteraceae-Chenopodiaceae Zone. Mildenhall and Pocknall (1989) concluded a cool temperate climate for this zone, contrasting with the subtropical to warm temperate of the preceding zone. The appearance of Tricolpites trioblatus within the C. chenopodiaceoides Zone, a pollen type later identified by Martin (2000) with Wilsonia, a plant restricted to saline environments today, highlights a drop in moisture availability, as does the importance of charcoal. The discovery of grass charcoal is an important clue and suggests that the fires were no longer just burning forests, but that climate change and fire had combined to produce a patchwork of forests and grasslands. Stromatolites (Douglas, 1986, Lindqvist, 1994) represent another life form that characterizes this interval that may have quantifiable climatic requirements. There is no strong evidence for these finds reflecting a coastal environment. For example there are no diatoms or signs of tidal bedding and the invertebrate and fish fauna (with the exceptions of rare, probably bird-transported, marine specimens, Schwarzhans et al., 2012) is freshwater. The boundary between the Manuherikia Group and the marine environment remains unclear, but regional geology would require a shoreline within about 70 km of the area.
The evidence for sudden drying at the base of the Casuarinaceae Zone is strong, but is there any evidence for the global cooling that Pole (2003) proposed as the driving force? The presence of a crocodile (Molnar and Pole, 1997) would seem to contradict this. A crocodile is clear evidence that MAT was warmer than today or at least evidence against any extremes of cold at the time. However, Markwick (1998) concluded that 14.2°C was the absolute minimum MAT defining the limit of crocodilians today and a CMM of about 5.5°C. Thus it is possible to accommodate a significant drop in temperature from earlier MATs of at least 17-18°C and still have crocodiles.
Some of the bird remains associated with the crocodile (e.g., Worthy et al., 2007) have been suggested as temperature indicators. True flamingoes have not (yet) been recorded from the Manuherikia Group, but an interpreted sister taxon has, along with evidence of swiftlets. Present-day flamingos tend to occupy alkaline lakes in at least seasonally dry regions. The comment of Worthy et al. (2011) that “Ancestral flamingos and swiflets are entirely tropical today” is both confusing and incorrect. If by “ancestral flamingos” they are referring to the Paleodids they mention in the same article, these are extinct today, whereas the true flamingos today include a species, Phoenicopterus chilensis, that extends into temperate Patagonia (GBIF data indicates the genus ranging over a MAT of about 3 - 27°C). Swiftlets also range well outside the tropics (GBIF dataset indicates Aerodramus ranges= over a MAT of 14-27°C).
Worthy et al. (2011) further noted that the waterfowl fauna at St. Bathans (eight species of ducks, shelducks, and geese in six genera) is the “richest known site of Miocene waterfowl fauna in the world.” However, ducks at least, have a distribution that has been described as “antitropical” (Reichholf, 1983 p. 39). The high duck diversity at St. Bathans may be a good clue that the climate tended to be temperate rather than tropical.
In the palynological record, all the taxa that suggested warmer climates earlier in the Manuherikia Group have vanished. They are replaced in prominence by taxa that are now more cosmopolitan and consequently have very broad temperature ranges.
The abrupt disappearance of Arecaceae near the base of the Casuarinaceae Zone is one of the strongest cases for cooling. As long as there is groundwater, palms survive today in many overtly dry places - for example, isolated spots in the Australian arid zone and Saharan oases. It is clear from the sedimentary record that, despite mudcracks at some horizons indicating that marginal drying occurred from time to time, a sizeable Lake Manuherikia remained. Conditions did not get so dry that a regional presence of taxa, such as Nothofagus (probably on surrounding slightly higher ground), disappeared. It is difficult to imagine palms vanishing in this situation without a significant drop in temperature. The 0.98 percentile MAT minima for palms is about 12°C, though they range to nearly 10°C, and so their disappearance while crocodiles remained is a problem. The climate may be interpreted as the coolest end of MAT possible for a crocodile, probably aided by low annual extremes of temperature, and the chance extinction of the local palm species.
Could it be that the evident drying was the result of increased evaporation due to warming? This is highly unlikely. Firstly, if the drying was associated with a major warming event-and the Mid Miocene Climate Optimum would seem the most obvious possibility-then it may be the only case known where this event was associated with drying rather than generally wet conditions. It would also imply that as temperatures cooled again to continue the broader global Neogene trajectory, then there should have been a return to wet, coal-forming conditions, and there is no indication of this occurrence. Secondly, it is certainly theoretically possible for pure warming to cause drying out if the extra evaporation induces a rainfall deficit. However, to put this in perspective, in the ever-wet conditions around southern New Zealand today where monthly rainfall is above 60 mm, the Klimadiagram relationship suggests average temperatures would have to rise above 30°C to start a significant drought period. There is no evidence hinting at anything close to this level of temperature.
Late Middle - Early Late Miocene
The paleobotanical record for much of the middle and late Miocene is much more restricted than for the early Miocene. This results from a trend to non-coal forming environments, as well as geological factors, including much of the southern end of New Zealand being inundated by thick gravel from rising mountains (Browne and Field, 1985; Youngson et al., 1998). Nothofagusfusca -type pollen is commonly important in pollen assemblages of this age (Mildenhall and Pocknall, 1984).
The Dunedin Volcano, active from the early middle to early late Miocene, lies to the east of the Manuherikia Group and is surrounded by the broader-aged Waipiata Volcanics (Coombs et al., 1960, 2008). Two macrofossil assemblages have been documented from the Dunedin Volcano; Kaikorai Valley and Taiaroa Head (Oliver, 1936; Pole, 1993h), and one from the late Miocene of the Waipiata Volcanics: Cornish Head (Pole, 1994). All are overwhelmingly dominated by Nothofagus. The Kaikorai Valley material has some cuticle, and whilst the Cornish Head locality does not, it is unique in that the leaves clearly show plicate vernation, which is correlated today with an annually deciduous habit (Hill and Jordan, 1993; Pole, 1994). The strongest evidence for climate is the range of leaf size, which is spread over nanophyll-microphyll with no notophylls. This small size of the Kaikorai Valley leaves suggests cool temperate conditions with a MAT of around 10-11°C, consistent with the low diversity and dominance by Nothofagus. MAT had therefore most likely dropped from the early-earliest middle Miocene, probably by at least 6-7°C, but the confounding effects of possible drop in precipitation cannot yet be ruled out. Coal is virtually absent from middle-late Miocene sediments in New Zealand and is probably a consequence of drier conditions (see comments in Mildenhall and Pocknall, 1984). Although lack of coal might partially reflect the general uplift and volcanism of the time, neither of these processes would preclude peat growth if rainfall were high enough, they would only limit its thickness. Other factors being equal, a drop in moisture levels would tend to decrease average leaf size.
Unlike the other deposits studied here, the Cornish Head leaves are preserved in a volcanic mudflow and therefore may be preserving a slope flora, as compared with the more usual basins. It is possible that the deciduous Nothofagus preserved there were regionally dominant in the uplands of New Zealand at the time, much as they are in parts of Patagonia today.
Similar Nothofagus -dominated macrofloral assemblages are known from volcanigenic sediments on Great Barrier Island (Figure 15.1) and from parts of the Coromandel Peninsula (Hayward, 1974). However, at another Coromandel location, Mataora, temperatures appear to have been too cool for even Nothofagus and Lauraceae (Pole and Moore, 2011). The combination of small leaves and the taxa that are present, as well as those notable by their absence, suggest temperatures were distinctly cool, with a MAT around 6-7°C ( this is less than today where the MAT = 13.6°C).
Two other assemblages are not associated with volcanic activity but with very coarse sedimentation. The probable middle Miocene Longford leaf beds near Murchison are found within thick conglomeratic units. A single bed consists almost entirely of very large Nothofagus leaves but slightly more diverse assemblages are present at other levels (Holden, 1982a, 1982b). The enormous size of these Nothofagus leaves (Figure 15.2) in the absence of any other good evidence for warmth or wetness suggests they may have been deciduous (their large size might reflect growing season MAT only). The gravel-dominated Glentanner Group of Ben Ohau, includes an assemblage of mid-sized Nothofagus leaves (unpublished material curated in the Canterbury Museum, Figure 15.3). Mildenhall (2001) dated probable correlative localities as Pliocene, but a late Miocene age cannot be ruled out. Beyond this region, leaf fossil assemblages are locally common in volcanic environments.
Changing Atmospheric Circulation
The combination of evidence from southern New Zealand suggests warmest and wettest conditions early in the Miocene, followed by a cooler and dryer mid Miocene, then somewhat wetter but cool later in the Miocene. A similar sequence has also been interpreted from the fossil wood record of northern New Zealand (Moore and Wallace, 2000). This combination of temperature and rainfall regimes apparent from the New Zealand Miocene is likely to have also involved changing atmospheric circulation patterns, something of obvious interest in the present situation of global warming. Pole (2003) expanded on an earlier model of Bowler (1982) where the subtropical high pressure cells once tracked at much higher latitudes and would have produced relatively dry conditions as they passed over New Zealand. Their tracks subsequently moved equatorward, presumably in response to expanding cooler oceans as marked by the SubTropical Front (Nelson and Cooke, 2001). More recently, You (2010) has modeled middle Miocene climate under a range of carbon dioxide forcings. His models produced vectors of near-surface wind velocity and his figure 11 shows a high pressure cell (anticlockwise gyre) in the Southern Ocean, at a higher latitude than New Zealand (c. 60°S), which lay beneath a low pressure system. This is part of a growing body of research relating a poleward shift of the downward limb of the Hadley cells to carbon dioxide forcing and global warming (e.g., Farrell, 1990; Lu et al., 2007; Seidel et al., 2008).
CONCLUSIONS
Estimates of paleoclimate have gone through a remarkable ‘progression’. From using often variously defined terms such as “warm temperate” or “subtropical”, to the more recent results of foliar physiognomy where aspects of temperature and rainfall are reported to the tenth of a degree and to the millimeter. These more ‘precise’ figures tend to be associated with a virtually cavalier attitude to the taxonomy that they are based on. One might hope that recent comments on the accuracy of these techniques, for example, Royer’s (2012) that foliar physiognomy has at least an error of ±5C, and that the NLR approach is “useless’, might at least focus more attention on primary documentation. These conclusions, mostly concerning the most intensively studied variable, MAT, ought to be sobering. We are probably a long way from obtaining accurate estimates of precipitation. At the very time when the scientific community would welcome accurate paleoclimate estimates to test the validity of climate models - such estimates seem to remain elusive.
For the New Zealand early-earliest middle Miocene (lying at about 50 °S), all proxies suggest conditions, probably MATs, were warmer than today. The paleobotanical data suggest that early Miocene MATs in New Zealand were several degrees above what they are now. There are reasonable grounds for accepting MATs reaching approximately 18°C - about 10 degrees warmer than present coastal MATs. In qualitative terms, these temperatures correspond to “subtropical” in the scheme of Wolfe (1979) and Webb (1968), “warm temperate" according to Pocknall (1989) and “mesothermal” according to Nix (1982). They are at the upper range of Pocknall’s (1989) estimates. Hornibrook’s (1992) estimate of 21°C was for the latitude of Wellington which lies about 4 degrees north of the key southern NZ fossil sites analysed in this paper. Based on the Miocene MAT gradient (You et al., 2010), the southern sites would have been about 2.5°C cooler, and thus about 18-19°C. The MAT estimates derived here are therefore entirely agreeable with that of Hornibrook (1992) and also with Cooke et al.’s (2008) conclusions from isotopic work. This also agrees closely with the 18°C estimate of Sluiter et al. (1995), for the southern margin of Australia, although it is concluded here that with the species, distribution data now available, such a precise estimate was not possible with their data. These temperatures exceed the estimates for this latitude modeled by You et al. (2010), which corresponded to a global average temperature about 3-4°C warmer than today and highlight on-going difficulties to reconcile models with proxies. This temperature exceeds that of northernmost New Zealand today, but is comparable with Norfolk Island, Lord Howe Island, and coastal northern New South Wales. There is no support from the plant fossils that temperatures in the New Zealand Miocene ever reached tropical/megathermal (above c. 24°C). The differences between all these methods are probably more apparent than real, as they likely all fall within a broad range of error. Although paleobotanical methods can be criticized for using unrealistic margins of error, marine invertebrate paleontology methods typically provide none at all.
In the middle Miocene abrupt climate change probably occurred. Rainfall decreased and fire became an important factor. The exact timing is open to debate, and the temperature drop is difficult to ascertain with current techniques. If MAT was about 14°C, then there was a drop of at least 3°C from the most minimal estimate of maximum Miocene warmth. By the end of the middle Miocene, there is more robust evidence of a significant MAT decline from the early Miocene. For example, the leaf assemblage from Kaikorai Valley has no notophylls, leaf length that suggests a MAT of around 7-14°C, and dominance by Nothofagus. The extant N. moorei forests of Australia, with MAT of about 10-17°C, are broadly comparable.
The key result of this paper is an affirmation how warm New Zealand was during the Mid Miocene Climate Optimum. Although truly tropical temperatures may never have been achieved, notably elevated temperatures appear to remain a problem for climate modeling. The broader record of climate change preserved in the New Zealand Miocene has some significant implications for understanding global climate change. The stratigraphic succession in the St. Bathans - Mata Creek - Manuherikia River sections provide a well-documented record of abrupt climate change. New Zealand went from an everwet, peat-accumulating landscape, to a much drier and fire-prone one. The fact of abrupt climate change and the opportunity to further document it at these localities give them a global significance. The implications of what actually caused this climate change, in an atmospheric circulation sense, have clear significance for the development of global climate models. This is especially the case as the long-term latitudinal movement of atmospheric circulation belts seems to be poorly understood (if believed at all). Furthermore, understanding the development of New Zealand into a ‘burning land’ is also of particular importance in those regions today, such as Australia and the Mediterranean, where global warming is expected to shift the balance in favour of fire.
New Zealand’s small size, and even smaller size and low topography in the Neogene, are its strength, helping to give a relatively “pure” indication of climate as it sat in the Pacific Ocean. All the more so as such detailed fossil records of the Miocene are not known from other southern continents. Future work will no doubt refine the results and make a worthwhile contribution to global climate and vegetation evaluation.
ACKNOWLEDGMENTS
Special thanks to A. Kemp and T.L. Dutra, the GBIF. The detailed input of two anonymous reviewers that greatly improved the manuscript is highly appreciated.
REFERENCES
Adams, C.G., Lee, D., and Rosen, B.R. 1990. Conflicting isotopic and biotic evidence for tropical sea-surface temperatures during the Tertiary. Palaeogeography, Palaeoclimatology, Palaeoecology, 77: 289-313.
Angiosperm Phylogeny Group 2009. An update of the Angiosperm Phylogeny Group classification for the orders and families of flowering plants: APG III. Botanical Journal of the Linnean Society, 161:105-121.
Arroyo, M.T.K., Mihoc, P., Pliscoff, P., and Arroyo-Kalin, M. 2005. The Magellanic moorland, p. 424-445. In Fraser, L.H. and Keddy, P.A. (eds.), The World's Largest Wetlands. Ecology and Conservation. Cambridge University Press, Cambridge.
Bailey, I.W. and Sinnott, E.W. 1916. The climatic distribution of certain types of angiosperm leaves. American Journal of Botany, 3:24-39.
Baines, P.G. 1983. A survey of of blocking mechanisms, with application to the Australian region. Australian Meteorological Magasine, 31:27-36.
Bannister, J.M., Conran, J.G., and Lee, D.E. 2012. Lauraceae from rainforest surrounding an early Miocene maar lake, Otago, southern New Zealand. Review of Palaeobotany and Palynology, 178:13-34.
Bannister, J.M., Lee, D.E., and Raine, J.I. 2005. Morphology and palaeoenvironmental context of Fouldenia staminosa, a fossil flower with associated pollen from the early Miocene of Otago, New Zealand. New Zealand Journal of Botany, 43:515-525.
Bastos, B.L., Dutra, T.L., Wilberger, T.P., and Trevisan, C. 2013. Uma flora do final do Cretáceo na ilha Nelson, ilhas Shetland do Sul, Península Antártica (A Late Cretaceous flora from Nelson Island (Rip Point), South Shetland islands, Antarctic Peninsula). Revista Brasileira de Paleontologia, 16:441-464.
Beu, A.G. 1974. Molluscan evidence of warm sea temperatures in New Zealand during Kapitean (Late Miocene) and Waipipian (middle Pliocene) time. New Zealand Journal of Geology and Geophysics, 17:465-479.
Beu, A.G. 1990. Molluscan generic diversity of New Zealand Neogene stages: extinction and biostratigraphic events. Palaeogeography, Palaeoclimatology, Palaeoecology, 77:279-288.
Böhme, M. 2003. The Miocene Climatic Optimum: evidence from ectothermic vertebrates of Central Europe. Palaeogeography, Palaeoclimatology, Palaeoecology, 195:389-401.
Booden, M.A., Smith, I.E.M., Mauk, J.L., and Black, P.M. 2012. Geochemical and isotopic development of the Coromandel Volcanic Zone, northern New Zealand, since 18 Ma. Journal of Volcanology and Geothermal Research, 219-220:15-32.
Bowler, J.M. 1982. Aridity in the late Tertiary and Quaternary of Australia, p. 35-45. In Barker, W.R. and Greenslade, P.J.M. (eds.), Evolution of the Fauna and Flora of Arid Australia. Peacock Publications, Adelaide.
Bowman, D.M.J.S. 2000. Australian Rainforests: Islands of Green in a Land of Fire. Cambridge University Press, Cambridge.
Box, E.O. 1981. Macroclimate and Plant Forms. An Introduction to Predictive Modeling in Phytogeography. Dr. W. Junk Publishers, The Hague.
Brathwaite, R.I. and Christie, A.B. 1996. Geology of the Waihi area. Institute of Geological and Nuclear Sciences Geological Map, 21.
Browne, G.H. and Field, B.D. 1985. The lithostratigraphy of Late Cretaceous to early Pleistocene rocks of northern Canterbury, New Zealand. New Zealand Geological Survey Record, 6:1-63.
Bruenig, E.F. 1990. Oligotrophic Forested Wetlands in Borneo, p. 299-334. In Lugo, A.E., Brinson, M., and Brown, S. (eds.), Forested Wetlands. Oligotrophic Forested Wetlands in Borneo. Elsevier, Amsterdam.
Burnham, R.J. 1989. Relationships between standing vegetation and leaf litter in a paratropical forest implications for paleobotany. Review of Palaeobotany and Palynology, 58:5-32.
Burnham, R.J., Pitman, N.C.A., Johnson, K.R., and Wilf, P. 2001. Habitat-related error in estimating temperatures from leaf margins in a humid tropical forest. American Journal of Botany, 88:1096-1102.
Burnham, R.J., Wing, S.L., and Parker, G.G. 1992. The reflection of deciduous forest communities in leaf litter. Implications for autochthonous litter assemblages from the fossil record. Paleobiology, 18:30-49.
Cain, S.A. and Castro, O.G.M. de, 1959. Manual of Vegetation Analysis. Harper, New York.
Campbell, J.D. 1985: Casuarinaceae, Fagaceae, and other plant macrofossils from Kaikorai leaf beds (Miocene) Kaikorai Valley, Dunedin, New Zealand. New Zealand Journal of Botany, 23:311-320.
Campbell, J.D. and Holden, A.M. 1984. Miocene casuarinacean fossils from Southland and Central Otago, New Zealand. New Zealand Journal of Botany, 22:159-167.
Carpenter, R.J. 1994. Cuticular morphology and aspects of the ecology and fossil history of North Queensland rainforest Proteaceae. Botanical Journal of the Linnean Society, 116:249-303.
Carpenter, R.J., Hill, R.S., and Jordan, G.J. 1994. Cenozoic vegetation in Tasmania. macrofossil evidence, p. 276-298. In Hill, R.S. (ed.), History of the Australian Vegetation. Cretaceous to Recent. Cambridge University Press, Cambridge.
Carpenter, R.J., Bannister, J.M., Jordan, G.J., and Lee, D.E. 2010a. Leaf fossils of Proteaceae tribe Persoonieae from the Late Oligocene-Early Miocene of New Zealand. Australian Systematic Botany, 23:1-15.
Carpenter, R.J., Jordan, G.J., Lee, D.E., and Hill, R.S. 2010b. Leaf fossils of Banksia (Proteaceae) from New Zealand. An Australian abroad. American Journal of Botany, 97:288-297.
Carpenter, R.J., Jordan, G.J., Macphail, M.K., and Hill, R.S. 2012. Near-tropical Early Eocene terrestrial temperatures at the Australo-Antarctic margin, western Tasmania. Geology, 40:267-270.
Chamberlain, C.P., Poage, M.A., Craw, D., and Reynolds, R.C. 1999. Topographic development of the Southern Alps recorded by the isotopic composition of authigenic clay minerals, South Island, New Zealand. Chemical Geology, 155:279-294.
Christophel, D.C. 1984. Early Tertiary Proteaceae. The first floral evidence for the Musgraveinae. Australian Journal of Botany, 32:177-186.
Christophel, D.C. and Gordon, P. 2004. Genotypic control and environmental plasticity--foliar physiognomy and paleoecology. New Phytologist, 161:327-329.
Conran, J.G., Bannister, J.M., and Lee, D.E. 2009. Earliest orchid macrofossils: early Miocene Dendrobium and Earina (Orchidaceae: Epidendroideae) from New Zealand. American Journal of Botany, 96:466-474.
Conran, J.G., Bannister, J.M., and Lee, D.E. 2013. Fruits and leaves with cuticle of Laurelia otagoensis sp. nov. (Atherospermataceae) from the Early Miocene of Otago (New Zealand). Alcheringa: An Australasian Journal of Palaeontology, 37:1-14.
Conran, J.G., Kaulfuss, U., Bannister, J.M., Mildenhall, D.C., and Lee, D.E. 2010. Davallia (Polypodiales: Davalliaceae) macrofossils from Early Miocene Otago (New Zealand) with in situ spores. Review of Palaeobotany and Palynology, 162:84-94.
Cooke, P.J., Nelson, C.S., and Crundwell, M.P. 2008. Miocene isotope zones, paleotemperatures, and carbon maxima events at intermediate water-depth, Site 593, Southwest Pacific. New Zealand Journal of Geology and Geophysics, 51:1-22.
Coombs, D.S., White, A.J.R., and Hamilton, D. 1960. Age relations of the Dunedin volcanic complex and some paleogeographic implications - part II. New Zealand Journal of Geology and Geophysics, 3:572-579.
Coombs, D.S., Adams, C.J., Roser, B.P., and Reay, A. 2008. Geochronology and geochemistry of the Dunedin Volcanic Group, eastern Otago, New Zealand. New Zealand Journal of Geology and Geophysics, 51:195-218.
Coombs, D.S., Cas, R.A., Kawaxhi, Y., Landis, C.A., McDonough, W.F., and Reay, A. 1986. Cenozoic volcanism in north, east, and Central Otago. Royal Society of New Zealand Bulletin , 23:278-312.
Couper, R.A. 1953b. Upper Mesozoic and Cainozoic spores and pollen grains from New Zealand. New Zealand Geological Survey Palaeontological Bulletin n.s., 22:1-77.
Couper, R.A. 1953a. Plant microfossil dating of some New Zealand Upper Tertiary volcanic rocks. New Zealand Journal of Science and Technology, 34B:373-377.
Couper, R.A. 1960a. New Zealand Mesozoic and Cainozoic plant microfossils. New Zealand Geological Survey Paleontological Bulletin, 32:1-88.
Couper, R.A. 1960b. Plant microfossils from the middlemarch Diatomite. Appendix to Coombs, D.S., White, A.J.R., Hamilton, D., and Couper, R.A. Age relations of the Dunedin volcanic complex and some paleogeographic implications--Part II .New Zealand Journal of Geology and Geophysics, 34:572-579.
Crisp, M., Cook, L., and Steane, D. 2004. Radiation of the Australian flora: what can comparisons of molecular phylogenies across multiple taxa tell us about the evolution of diversity in present-day communities? Philosophical Transactions of the Royal Society of London, B 359:1551-1571.
Crundwell, M.P., Beu, A.G., Cooper, R.A., Morgans, H.E.G., Mildenhall, D.C., and Wilson, G.S. 2004. Miocene, p. 165-194. In Cooper, R.A. (ed.), The New Zealand Geological Timescale. Institute of Geological and Nuclear Sciences Monograph, 22.
Dawson, J. 1968. The Tertiary Climate of New Zealand Issue. Tuatara, 16.
Dettmann, M. E., Pocknall, D. T., Romero, E.J., and Zamaloa, M. de C. 1990. Nothofagidites Erdtman ex Potonié. 1960; a catalogue of species with notes on the paleogeographic distribution of Nothofagus Bl.southern beech. New Zealand Geological Survey paleontological bulletin, 60:1-79.
Devereux, I. 1968. Oxygen Isotope Paleotemperatures from the Tertiary of New Zealand. Tuatara, 16:41-44.
Dilcher, D.L. 1973. A Paleoclimatic Interpretation of the Eocene Floras of Southeastern North America, p. 39-59. In Graham A. (ed.), Vegetation and Vegetational History of Northern Latin America. Elsevier, Amsterdam.
Dilcher, D.L. 1974. Approaches to the identification of angiosperm leaf remains. The Botanical Review, 40:1-157.
Dilcher, D.L., Kowalski, E.A., Wiemann, M.C., Hinojosa, L.F., and Lott, T.A. 2009. A climatic and taxonomic comparison between leaf litter and standing vegetation from a Florida swamp woodland. American Journal of Botany, 96:1108-1115.
Douglas, B.J. 1986. Lignite resources of Central Otago. New Zealand Energy Research and Development CommitteePublication, P104.
Dutra, T.L. 2004. Paleofloras da Antártica e sua relação com os eventos tectônicos e paleoclimáticos nas altas latitudes do Sul. Revista Brasileira de Geociências, 34:401-410.
Dutra, T.L. 2007. Part II. Leaf assemblages (Taphonomy, Paleoclimatology and Paleogeography), p. 194-202. In Koutsoukos, E.A.M. (ed.), Applied Stratigraphy. Series: Topics in Geobiology, 23. Springer, Dordrecht.
Evans, W.P. 1931. A fossil Nothofagus ( Nothofagoxylon ?) from the Central Otago coal-measures. Transactions of the New Zealand Institute, 62:98.
Farjon, A. 2010. A Handbook of the World’s Conifers. Brill Academic Publishers, Leiden.
Farrell, B.F. 1990. Equable climate dynamics. Journal of the Atmospheric Sciences, 47:2986-2995.
Fensham, R.J. 1996. The floristics and structure of dry rainforest at Forty Mile Scrub National Park, north Queensland. Cunninghamia, 4:483-495.
Field, B.D., Crundwell, M.P., Kennett, J.P., King, P.R., Jones, C.M., and Scott, G.H. 2002. The early Middle Miocene paleoenvironmental setting of New Zealand. Revista Mexicana de Ciencias Geológicas, 19:242-251.
Field, B.D., Crundwell, M.P., Lyon, G.L., Mildenhall, D.C., Morgans, H.E.G., Ohneiser, C., Wilson, G.S., Kennet, J.P., and Chanier, F. 2009. Middle Miocene paleoclimate change at Bryce Burn, southern New Zealand. New Zealand Journal of Geology and Geophysics, 52:321-333.
Flenley, J.R. 1995. Cloud forest, the Massenerhebung effect, and ultraviolet insolation, p. 150-155. In Hamilton, L.S., Juvik, J.O., and Scatena, F.N. (eds.), Tropical Montane Cloud Forests. Cloud forest, the Massenerhebung effect, and ultraviolet insolation. Springer-Verlag. New York.
Florindo, F. and Siegert, M., (eds.), 2009. Antarctic Climate Evolution. Amsterdam, Elsevier.
Fleming, C.A., Hornibrook, N. de B., and Wood, B.L. 1969. Geology of the Clifden Section. Chapter 4 In. Wood, B.L. (ed.), Geology of Tuatapere Subdivision, Western Southland. New Zealand Geological Survey Bulletin, 79: 71–98.
Flower, B.P. and Kennett, J.P. 1994. The middle Miocene climatic transition East Antarctic ice sheet development, deep ocean circulation and global carbon cycling. Palaeogeography, Palaeoclimatology, Palaeoecology, 108:537-555.
Francis, A.P. and Currie, D.J. 2003. A globally consistent richness-climate relationship for angiosperms. American Naturalist, 161:523-536.
Frederiksen, N.O. 1980. Sporomorphs from the Jackson Group (Upper Eocene) and adjacent strata of Mississippi and Western Alabama. Geological Society Professional Paper , 1084:1-75.
Goldner, A., Herold, N., and Huber, M. 2013. The challenge of simulating warmth of the mid-Miocene Climate Optimum in CESM1. Climate of the Past Discussions, 9:3489-3518.
Green, W.A. 2006. Loosening the CLAMP. An exploratory graphical approach to the Climate Leaf Analysis Multivariate Program. Palaeontologia Electronica 9 Issue 2; 9A17p, 1.63MB;
palaeo-electronica.org/paleo/2006_2/clamp/index.html.
Greenwood, D.R. 1992. Taphonomic constraints on foliar physiognomic interpretations of Late Cretaceous and Tertiary palaeoclimates. Reviews of Palynology and Palaeobotany, 71:149-190.
Greenwood, D.R. 2005. Leaf form and the reconstruction of past climates. New Phytologist, 166:355-369.
Greenwood, D.R., Moss, P.T., Rowett, A.I., Vadala, A.J., and Keefe, R.L. 2003. Plant communities and climate change in southeastern Australia during the early Paleogene. In Wing, S.L., Gingerich, P., Schmitz, B., and Thomas, E. (eds.), Causes and Consequences of Globally Warm Climates in the Early Paleogene. Plant communities and climate change in southeastern Australia during the early Paleogene. Geological Society of America Special Paper, 369:365-380.
Greenwood, D.R. and Wing, S.L. 1995. Eocene continental climates and latitudinal temperature gradients. Geology, 23:1044-1048.
Greenwood, D.R., Wilf, P., Wing, S.L., and Christophel, D.C. 2004. Paleotemperature estimation using leaf-margin analysis is Australia different? Palaios, 19:129-142.
Grimm, G.W. and Denk, T. 2012. Reliability and resolution of the coexistence approach -- A revalidation using modern-day data. Review of Palaeobotany and Palynology, 172:33-47.
Grubb, P.J. 1971. Interpretation of the 'Massenerhebung' Effect on tropical mountains. Nature, 229:44-45.
Hayward, B. 1974. Whitianga Group sediments of the Table Mountain area, Coromandel Peninsula. Journal of the Royal Society of New Zealand, 4:161-176.
Hayward, B.W. 1977. Lower Miocene corals from the Waitakere Ranges, North Auckland, New Zealand. Journal of the Royal Society of New Zealand, 7:99-11.
Hayward, B.W., Moore, P.R., and Gibson, G. 1990. How warm was the Late Oligocene in New Zealand? Coconuts, reef corals and larger foraminifera. Geological Society of New Zealand Newsletter, 90:39-41.
Hickey, L.J. 1973. Classification of the architecture of dicotyledonous leaves. American Journal of Botany, 60:17-33.
Hickey, L.J. 1979. A revised classification of the architecture of Dicotyledonous leaves, p. 25-39. In Metcalfe, C.R. and Chalk, L. (eds.), Anatomy of the Dicotyledons. Clarendon Press, Oxford.
Hijmans, R.J., Cameron, S.E., Parra, J.L., Jones, P.G., and Jarvis, A. 2005. Very high resolution interpolated climate surfaces for global land areas. International Journal of Climatology, 25:1965-1978.
Hill, R.S. 1982. The Eocene megafossil flora of Nerriga, New South Wales, Australia. Palaeontographica Abt B, 181:44-77.
Hill, R.S. 1983. Evolution of Nothofagus cunninghamii and its relationship to N. moorei as inferred from Tasmanian macrofossils. Australian Journal of Botany, 31:453-465.
Hill, R.S. and Carpenter, R.J. 1989. Tertiary gymnosperms from Tasmania. Cupressaceae. Alcheringa, 13:89-102.
Hill, R.S. and Jordan, G.J. 1993. The evolutionary history of Nothofagus (Nothofagaceae). Australian Systematic Botany, 6:11-126.
Hill, R.S. and Read, J. 1991. A revised infrageneric classification of Nothofagus (Fagaceae). Botanical Journal of the Linnean Society, 105:37-72.
Holden, A.M. 1982a. Fossil Nothofagus from the Longford Formation, Murchison, New Zealand. Journal of the Royal Society of New Zealand, 12:65-77.
Holden, A.M. 1982b. Fossil Lauraceae and Proteaceae from the Longford Formation, Murchison, New Zealand. Journal of the Royal Society of New Zealand, 12:79-80.
Holdgate, G.R., Cartwright, I., Blackburn, D.T., Wallace, M.M., Gallagher, S.J., Wagstaff, B.E., and Chung, L. 2007. The Middle Miocene Yallourn coal seam -- the last coal in Australia. International Journal of Coal Geology, 70:95-115.
Hornibrook, N. de B. 1968. Distribution of some warm water benthic foraminifera in the N.Z. Tertiary. Tuatara 16:11-15.
Hornibrook, N. de B. 1978. Tertiary climate, p. 436-443. In Suggate, R.P. (ed.), The Geology of New Zealand. Volume II. Wellington, Government Printer.
Hornibrook, N. de B. 1992. New Zealand Cenozoic marine paleoclimates a review based on the distribution of some shallow water and terrestrial biota, p. 83-106. In Tsuchi, R. and Ingle Jr, J.C. (eds.), Pacific Neogene. Environment, Evolution, and Events. Tokyo, University of Tokyo Press.
Isaac, M.J. and Lindqvist, J.K. 1990. Geology and lignite resources of the East Southland Group, New Zealand. New Zealand Geological Survey Bulletin n.s., 101:1-202.
Jackson, W.D. 1968. Fire, air, water and earth - an elemental ecology of Tasmania. Proceedings of the Ecological Society of Australia, 3:9-16.
Jacobs, B.F. 1999. Estimation of rainfall variables from leaf characters in tropical Africa. Palaeogeography, Palaeoclimatology, Palaeoecology, 145:231-250.
Jarzen, D.M. 1980. The occurrence of Gunnera pollen in the fossil record. Biotropica, 12:117-123.
Jenkins, D.G. 1968. Variations in the numbers of species, and subspecies of planktonic foraminifera as an indicator of New Zealand Cenozoic paleotemperatures. Palaeogeography, Palaeoclimatology, Palaeoecology, 5:309-313.
Johnson, L.A.S. 1980. Notes on Casuarinaceae. Telopea, 2:83-84.
Johnson, L.A.S. 1982. Notes on Casuarinaceae II. Journal of the Adelaide Botanical Garden, 6:73-87.
Johnson, L.A.S. 1988. Notes on Casuarinaceae III. The new genus Ceuthostoma. Telopea, 3:133-137.
Jordan, G.J. 1997a. Uncertainty in palaeoclimatic reconstructions based on leaf physiognomy. Australian Journal of Botany, 45:527-547.
Jordan, G.J. 1997b. Evidence of Pleistocene plant extinction and diversity from Regatta Point, western Tasmania, Australia. Botanical Journal of Linnean Society, 123:45-71.
Jordan, G.J., Carpenter, R.J., Bannister, J.M., Lee, D.E., Mildenhall, D.C., and Hill, R.S. 2011. High conifer diversity in Oligo-Miocene New Zealand. Australian Systematic Botany, 24:121-136.
Kennedy, E.M. 2003. Late Cretaceous and Paleocene terrestrial climates of New Zealand: leaf fossil evidence from South Island assemblages. New Zealand Journal of Geology and Geophysics,46 :295-306.
Kennett, J.P. 1967. Recognition and correlation of the Kapitean Stage (Upper Miocene, New Zealand). New Zealand Journal of Geology and Geophysics, 10:1051-1063.
Kershaw, A.P. and Nix, H.A. 1988. Quantitative palaeoclimatic estimates from pollen data using bioclimatic profiles of extant taxa. Journal of Biogeography, 15:589-602.
Keyes, I.W. 1968. Cenozoic marine temperatures Indicated by the Scleractinian coral fauna of New Zealand. Tuatara, 16:21-25.
Kira, T. 1977. A climatological interpretation of the Japanese vegetation zones, p. 21-30. In Miyawaki, A. and Taxen, R. (eds.), Vegetation Science and Environmental Protection. Maruzen, Tokyo.
Krapp, M. and Jungclaus, J.H. 2011. The Middle Miocene climate as modelled in an atmosphere-ocean-biosphere model. Climate of the Past, 7:1169-1188.
Landis, C.A., Campbell, H.J., Begg, J.G., Mildenhall, D.C., Paterson, A.M., and Trewick, S.A. 2008. The Waipounamu Erosion Surface, questioning the antiquity of the New Zealand land surface and terrestrial fauna and flora. Geological Magazine, 145:173-197.
Lange, R.T. 1976. Fossil epiphyllous germlings, their living equivalents and their palaeohabitat value. Neues Jahrbuch Geologische und Paläontologische Abhandlungen, 151:142-165.
Lange, R.T. 1978. Southern Australian Tertiary epiphyllous fungi, modern equivalents in the Australasian region, and habitat indicator value. Canadian Journal of Botany, 56:532-541.
Leathwick, J., Morgan, F., Wilson, G., Rutledge, D., McLeod, M., and Johnston, K. 2002. Land Environments of New Zealand. A Technical Guide. Ministry for the Environment, Wellington.
Lee, D.E., Bannister, J.M., and Lindqvist, J.K. 2007. Late Oligocene-Early Miocene leaf macrofossils confirm a long history of Agathis in New Zealand. New Zealand Journal of Botany, 45:565-578.
Lee, D.E., Bannister, J.M., Raine, J.I., and Conran, J.G. 2010. Euphorbiaceae: Acalyphoideae fossils from early Miocene New Zealand: Mallotus - Macaranga leaves, fruits, and inflorescence with in situ Nyssapollenitesendobalteus pollen. Review of Palaeobotany and Palynology, 163:127-138.
Lihou, J.C. 1993. The structure and deformation of the Murchison Basin, South Island, New Zealand. New Zealand Journal of Geology and Geophysics, 36: 95–105.
Lindqvist, J.K. 1994. Lacustrine stromatolites and oncoids Manuherikia Group (Miocene), New Zealand, p. 227-254. In Bertrand-Safati, J. and Monty, C. (eds.), Phanerozoic Stromatolites II. Kluwer Academic Publishers, New York.
Lindqvist, J.K. and Lee, D.E. 2009. High-frequency paleoclimate signals from Foulden Maar, Waipiata Volcanic Field, southern New Zealand. An Early Miocene varved lacustrine diatomite deposit. Sedimentary Geology, 222:98-110.
Little, S.A., Kembel, S.W., and Wilf, P. 2010. Paleotemperature Proxies from leaf fossils reinterpreted in light of vvolutionary history. PLoS ONE, 5(12)e15161. doi10.1371/journal.pone.0015161.
Lu, J., Vecchi, G.A., and Reichler, T. 2007. Expansion of the Hadley cell under global warming. Geophysical Research Letters34, L06805, doi.10.1029/2006GL028443.
Markwick, P.J. 1998. Fossil crocodilians as indicators of Late Cretaceous and Cenozoic climates implications for using palaeontological data in reconstructing palaeoclimate. Palaeogeography, Palaeoclimatology, Palaeoecology, 137:205-271.
Martin, H.A. 1977. The history of Ilex (Aquifoliaceae) with special reference to Australia: evidence from pollen. Australian Journal of Botany, 25:655-673.
Martin, H.A. 1992. The Tertiary of southeastern Australia: was it tropical? Palaeobotanist, 39:270-280.
Martin, H.A. 2000. Re-assignment of the affinities of the fossil pollen type Tricolpites trioblatus Mildenhall and Pocknall to Wilsonia (Convolvulaceae) and a reassessment of the ecological interpretations. Review of Palaeobotany and Palynology, 111:237-251.
McGlone, M.S. 1988. New Zealand, p. 557-602. In Huntley, B. and Webb III, T. (eds.), Vegetation History. Dordrecht, Kluwers.
McGlone, M.S., Mildenhall, D.C., and Pole, M.S. 1996. History and paleoecology of New Zealand Nothofagus forests, p. 83-130. In Veblen, T.T., Hill, R.S., and Read, J. (eds.), The ecology and biogeography of Nothofagus forest. Yale University.
McGowran, B. and Li, Q. 1994. The Miocene oscillation in southern Australia. In Pledge, N.S. (ed.), Australian Vertebrate Evolution, Palaeontology and Systematics. Records of the South Australian Museum, 27:197-212.
McIntyre, D.J. 1968. Further new pollen species from New Zealand Tertiary and uppermost Cretaceous deposits. New Zealand Journal of Botany, 6:177-204.
McQueen, D.R. 1977. The ecology of Nothofagus and associated vegetation in South America. Part 2. Tuatara, 22:233-245.
McQueen, D.R., Mildenhall, D.C., and Bell, C.J.E. 1968. Palaeobotanical evidence for changes in the Tertiary climates of New Zealand. Tuatara, 16:49-56.
Meyer, H.W. 1992. Lapse rates and other variables applied to estimating paleoaltitudes from fossil floras. Palaeogeography, Palaeoclimatology, Palaeoecology, 99:71-99.
Mildenhall, D.C. 1980. New Zealand Late Cretaceous and Cenozoic plant biogeography a contribution. Palaeogeography, Palaeoclimatology, Palaeoecology, 31:197-233.
Mildenhall, D.C. 1989. Summary of the age and paleoecology of the Miocene Manuherikia Group, Central Otago, New Zealand. Journal of the Royal Society of New Zealand, 19:19-29.
Mildenhall, D.C. 2001. Pollen analysis of Pliocene-Pleistocene Kowai Formation (Kurow Group), Mackenzie Basin, South Canterbury, New Zealand. New Zealand Journal of Geology and Geophysics, 44:97-104.
Mildenhall, D.C. and Harris, W.F. 1971. Status of Haloragicidites (al. Triorites ) harrisii (Couper) Harris comb. nov. and Haloragacidites trioratus Couper 1953. New Zealand Journal of Botany, 9:297-306.
Mildenhall, D.C. and Pocknall, D.T. 1984. Palaeobotanical evidence for changes in Miocene and Pliocene climates in New Zealand, p. 159-171. In Vogel, J.C. (ed.), Late Cainozoic Palaeoclimates of the Southern Hemisphere. A.A. Balkema.
Mildenhall, D.C. and Pocknall, D.T. 1989. Miocene-Pleistocene spores and pollen from Central Otago, South Island, New Zealand. New Zealand Geological Survey Palaeontological Bulletin, 59:1-128.
Mildenhall, D.C., Crundwell, M.P., and Field, B.D. 2003. Palynological evidence of climate change in New Zealand Miocene sequences. RCPNS 46 8th International Congress on Pacific Neogene Stratigraphy Chiang Mai February 2003 :406-417.
Miller, K.G., Wright, J.D., and Fairbanks, R.G. 1991. Unlocking the Ice House, Oligocene-Miocene oxygen isotopes, eustacy, and margin erosion. Journal of Geophysical Research, 96(B4):6829-6848.
Molnar, R.E. and Pole, M.S. 1997. A Miocene crocodilian from New Zealand. Alcheringa, 21:65-70.
Moore, P.R. and Wallace, R. 2000. Petrified wood from the Miocene volcanic sequence of Coromandel Peninsula, northern New Zealand. Journal of the Royal Society of New Zealand, 30:115-130.
Morgans, H.E.G., Edwards, A.R., Scott, G.H., Graham, I.J., Kamp, P.J.J., Mumme, T.C., Wilson, G.J., and Wilson, G.S. 1999. Integrated stratigraphy of the Waitakian-Otaian Stage boundary stratotype, Early Miocene, New Zealand. New Zealand Journal of Geology and Geophysics, 42: 581-614.
Morgans, H.E.G., Beu, A.G., Cooper, E.M., Crouch, E.M., Hollis, C.J., Jones, C.M., Raine, J.I., Strong, C.P., Wilson, G.J., and Wilson, G.S. 2004. Paleogene (Dannevirke, Arnold and Landon Series), p. 125-163. In Cooper, R.A. (ed.), The New Zealand Geological Timescale. Institute of Geological and Nuclear Sciences Monograph 22.
Mosbrugger, V. and Utescher, T. 1997. The coexistence approach -- a method for quantitative reconstructions of Tertiary terrestrial palaeoclimate data using plant fossils. Palaeogeography, Palaeoclimatology, Palaeoecology, 134:61-86.
Mount, A.B. 1982. Fire-cycles or succession in south-west Tasmania. Search, 13:174.
Muller, J. and Leenhouts, P.W. 1976. A general survey of pollen types in Sapindaceae in relation to taxonomy, p. 407-446. In Ferguson, I.K. and Muller, J. (eds.), The Evolutionary Significance of the Exine. A General Survey of Pollen Types in Sapindaceae in Relation to Taxonomy. Kew, Academic Press.
Müller, R.D., Sdrolias, M., Gaina, C., and Roest, W.R., 2008. Age, spreading rates and spreading asymmetry of the world's ocean crust, Geochemistry, Geophysics, Geosystems , 9, Q04006, doi.10.1029/2007GC001743.
Nelson, C.S. and Burns, D.A. 1982. Effect of sampling interval on the resolution of oxygen isotopic paleotemperature trends-an example from the New Zealand Early Miocene. New Zealand Journal of Geology and Geophysics, 25:77-81.
Nelson, C.S. and Cooke, P.J. 2001. History of oceanic front development in the New Zealand sector of the Southern Ocean during the Cenozoic--a synthesis. New Zealand Journal of Geology and Geophysics 44:535-553.
Nix, H. 1982. Environmental determinants of biogeography and evolution in Terra Australis, p. 47-66. In Barker, W.R. and Greenslade, P.J.M. (eds.), Evolution of the fauna and flora of arid Australia. Environmental determinants of biogeography and evolution in Terra Australis. Fremville, South Australia, Peacock Publications.
Nucete, M., van Konijnenburg-van Cittert, J.H.A., and van Welzen, P.C. 2012. Fossils and palaeontological distributions of Macaranga and Mallotus (Euphorbiaceae). Palaeogeography, Palaeoclimatology, Palaeoecology, 353-355:104-115.
Oliver, W.R.B. 1936. The Tertiary flora of the Kaikorai Valley, Otago, New Zealand. Transactions of the Royal Society of New Zealand, 66:284-304.
Paijmans, K. (ed.) 1976. New Guinea Vegetation. Australian National University Press Canberra.
Palazzesi, L. and Barreda, V. 2012. Fossil pollen records reveal a late rise of open-habitat ecosystems in Patagonia. Nature Communications, 3:1294. doi:10.1038/ncomms2299.
Parsons, R.F. 2007. The southernmost limits for palms. New Zealand Journal of Botany, 45:477-478.
Peppe, D.J., Royer, D.L., Cariglino, B., Oliver, S.Y., Newman, S., Leight, E., Enikolopov, G., Fernandez-Burgos, M., Herrera, F., Adams, J.M., Correa, E., Currano, E.D., Erickson, J.M., Hinojosa, L.F., Hoganson, J.W., Iglesias, A., Jaramillo, C.A., Johnson, K.R., Jordan, G.J., Kraft, N.J.B., Lovelock, E.C., Lusk, C.H., Niinemets, U., Peñuelas, J., Rapson, G., Wing, S.L., and Wright, I.J. 2011. Sensitivity of leaf size and shape to climate. Global patterns and paleoclimatic applications. New Phytologist, 190:724-739.
Pocknall, D.T. 1981. Pollen and spores from the Rifle Butts Formation (Altonian, Lower Miocene) Otago, New Zealand. New Zealand Geological Survey Report PAL, 40:1-15.
Pocknall, D.T. 1982a. Palynology of the Bluecliffs Siltstone (Early Miocene), Otaio River, South Canterbury, New Zealand. New Zealand Geological Survey Report, PAL Report, 55:1-26.
Pocknall, D.T. 1982b. Pollen and spores from Blue Lake, St Bathans (H41) and Hariwicks Lignite Pit, Roxburgh (G43), Central Otago, New Zealand. New Zealand Geological Survey Palynology Section report. Lower Hutt.
Pocknall, D.T. 1989. Late Eocene to Early Miocene vegetation and climatic history of New Zealand. Journal of the Royal Society of New Zealand, 19:1-18.
Pocknall, D.T. 1990. Palynological evidence for the Early to Middle Eocene vegetation and climate history of New Zealand. Review of Palaeobotany and Palynology, 65:57-69.
Pocknall, D.T. and Mildenhall, D.C. 1984. Late Oligocene-Early Miocene spores and pollen from Southland, New Zealand. New Zealand Geological Survey Paleontological Bulletin, 51:1-66.
Pole, M. 1989. Early Miocene floras from central Otago, New Zealand. Journal of the Royal Society of New Zealand, 19:121-125.
Pole, M.S. 1991. A modified terminology for angiosperm leaf architecture. Journal of the Royal Society of New Zealand, 21:297-312.
Pole, M.S. 1992a. Early Miocene flora of the Manuherikia Group, New Zealand. 1. Ferns. Journal of the Royal Society of New Zealand, 22:279-286.
Pole, M.S. 1992b. Early Miocene flora of the Manuherikia Group, New Zealand. 2. Conifer. Journal of the Royal Society of New Zealand 22:287-302.
Pole, M.S. 1992c. Fossils of Leguminosae from the Miocene Manuherikia Group of New Zealand, p. 251-258. In Herendeen, P.S. and Dilcher, D.L. (eds.), Advances in Legume Systematics: Part 4. The fossil record. The Royal Botanic Gardens, Kew.
Pole, M.S. 1993a. Early Miocene flora of the Manuherikia Group, New Zealand. 10. Paleoecology and stratigraphy. Journal of the Royal Society of New Zealand, 23:393-426.
Pole, M.S. 1993b. Miocene broad-leaved Podocarpus from Foulden Hills, New Zealand. Alcheringa, 17:173-177.
Pole, M.S. 1993c. Early Miocene flora of the Manuherikia Group, New Zealand. 8. Nothofagus. Journal of the Royal Society of New Zealand, 23:329-344.
Pole, M.S. 1993d. Early Miocene floras of the Manuherikia Group, New Zealand. 7. Myrtaceae, including Eucalyptus. Journal of the Royal Society of New Zealand, 23:313-328.
Pole, M.S. 1993e. Early Miocene flora of the Manuherikia Group, New Zealand. 5. Smilacaceae, Polygonaceae, Elaeocarpaceae. Journal of the Royal Society of New Zealand, 23:289-302.
Pole, M.S. 1993f. Early Miocene flora of the Manuherikia Group, New Zealand. 6. Lauraceae. Journal of the Royal Society of New Zealand, 23:303-312.
Pole, M.S. 1993g. Early Miocene flora of the Manuherikia Group, New Zealand. 9. Miscellaneous leaves and reproductive structures. Journal of the Royal Society of New Zealand, 23:345-391.
Pole, M.S. 1993h. Nothofagus from the Dunedin Volcanic Group (Mid-late Miocene), New Zealand. Alcheringa, 17:77-90.
Pole, M.S. 1993i. Early Miocene flora of the Manuherikia Group, New Zealand. 4. Palm remains. Journal of the Royal Society of New Zealand, 23:283-288.
Pole, M.S. 1994. Deciduous Nothofagus leaves from the Miocene of Cornish Head, New Zealand. Alcheringa, 18:79-83.
Pole, M.S. 1996. Plant macrofossils from the Foulden Hills Diatomite (Miocene), Central Otago, New Zealand. Journal of the Royal Society of New Zealand, 26:1-39.
Pole, M.S. 1997. Miocene conifers from the Manuherikia Group, New Zealand. Journal of the Royal Society of New Zealand, 27:355-370.
Pole, M.S. 1998. The Proteaceae record in New Zealand. Australian Systematic Botany, 11:343-372.
Pole, M.S. 2003. New Zealand climate in the Neogene and implications for global atmospheric circulation. Palaeogeography, Palaeoclimatology, Palaeoecology, 193:269-284.
Pole, M. 2007a. Lauraceae macrofossils and dispersed cuticle from the Miocene of Southern New Zealand. Palaeontologia Electronica 10.1.3A:38pp, 3.04MB; palaeo-electronica.org/2007_1/zealand/index.html.
Pole, M. 2007b. Conifer and cycad distribution in the Miocene of southern New Zealand. Australian Journal of Botany, 55:143-164.
Pole, M. 2007c. Monocot Macrofossils from the Miocene of Southern New Zealand. Palaeontologia Electronica 10.3.15A:21pp 2.04MB; palaeo-electronica.org/2007_3/125/125.pdf.
Pole, M. 2007d. Plant-macrofossil assemblages during Pliocene uplift, South Island, New Zealand. Australian Journal of Botany, 55:118-142.
Pole, M. 2008. Dispersed leaf cuticle from the Early Miocene of southern New Zealand. Palaeontologia Electronica 11.3.15A:117pp, 3.81MB; palaeo-electronica.org/2008_3/153/153.pdf.
Pole, M. 2010a. Was New Zealand a primary source for the New Caledonian flora? Alcheringa, 34:61-74.
Pole, M. 2010b. Cuticle morphology of Australasian Sapindaceae. Botanical Journal of the Linnean Society, 164:264-292.
Pole, M. and Douglas, B.J. 1998. A quantitative palynostratigraphy of the Miocene Manuherikia Group, New Zealand. Journal of the Royal Society of New Zealand, 28:405-420.
Pole, M. and Moore, P.R. 2011. A late Miocene leaf assemblage from Mataora, Coromandel, New Zealand and its climatic implications. Alcheringa, 35:103-121.
Pole, M.D., Dawson, J., and Denton, T. 2008. Fossil Myrtaceae from the Early Miocene of southern New Zealand. Australian Journal of Botany, 56:7-81.
Pole, M.S., Douglas, B.J., and Mason, G. 2003. The terrestrial Miocene biota of southern New Zealand. Journal of the Royal Society of New Zealand, 33:415-426.
Pole, M.S., Holden, A.M., and Campbell, J.D. 1989. Fossil legumes from the Manuherikia Group (Miocene), Central Otago, New Zealand. Journal of the Royal Society of New Zealand, 19:225-228.
Prider, J.N. and Christophel, D.C. 2000. Distributional ecology of Gymnostoma australianum (Casuarinaceae), a putative palaeoendemic of Australian wet tropic forests. Australian Journal of Botany, 48:427-434.
Punyasena, S.W. 2008. Estimating Neotropical palaeotemperature and palaeoprecipitation using plant family climatic optima. Palaeogeography, Palaeoclimatology, Palaeoecology , 265:226-237.
Raine, J.I., Mildenhall, D.C., and Kennedy, E.M. 2008. New Zealand fossil spores and pollen an illustrated catalogue. 3rd edition. GNS Science miscellaneous series no. 4. www.gns.cri.nz/what/earthhist/fossils/spore_pollen/catalog/index.htm.
Ramirez, C., Martin, C.S., Oyarzun, A., and Figueroa, H. 1997. Morpho-ecological study on the South American species of the genus Nothofagus. Plant Ecology, 130:101-109.
Raunkiaer, C. 1934. The Life Forms of Plants and Statistical Plant Geography. Oxford, Oxford University Press.
Read, J., Hope,G.S., and Hill,R.S. 2005. Phytogeography and climate analysis of Nothofagus subgenus Brassospora in New Guinea and New Caledonia. Australian Journal of Botany, 53,297-312.
Read, J., Hill, R.S., Hope, G.S. and Carpenter, R.J. 2010. The contrasting biology of tropical versus temperate Nothofagus species and its relevance to interpretations of Cenozoic rainforest history in southeast Australia. p. 15-21. In Haberle, S.G., Stevenson, J., and Prebble, M. (eds.) Altered Ecologies: Fire, climate and human influence on terrestrial landscapes (Terra Australis 32). Canberra, ANU ePress: 15-21.
Reguero, M., Goin, F., Hospitaleche, C.A., Dutra, T., and Marenssi, S. 2013. Late Cretaceous/Paleogene West Antarctica terrestrial biota and its intercontinental affinities. Springer Briefs in Earth System Sciences - South America and South Hemisphere, Springer, 120 p. DOI 10.1007/978-94-007-5491-1
Reichgelt, T., Kennedy, E.M., Mildenhall, D.C., Conran, J.G., Greenwood, D.R., and Lee, D.E. 2013. Quantitative palaeoclimate estimates for Early Miocene southern New Zealand: evidence from Foulden Maar. Palaeogeography, Palaeoclimatology, Palaeoecology, 378:36-44.
Reichholf, J. 1983. Patterns of higher vertebrates distribution in Tropical South America. Environmentalist3, Supplement, 5:35-40.
Romero, E.J. 1980. Arquitectura foliar de las especies Sudamericanas de Nothofagus Bl. Boletin de la Sociedad Argentina de Botanica, 19:289-308.
Rosenzweig, M.L. 1995. Species Diversity in Space and Time. Cambridge, Cambridge University Press.
Roth, L. and Lorscheitter, M.L. 2008. Palinomorfos de um perfil sedimentar em uma turfeira do Parque acional dos Aparados da Serra, leste do Planalto do Rio Grande do Sul, Brasil. Iheringia, Série Botânica, 63:69-100.
Royer, D. 2012. Climate reconstruction from leaf size and shape, new developments and challenges. In Ivany, L.C. and Huber, B.T. (eds.), Reconstructing Earth's Deep-Time Climate--The State of the Art in 2012.Paleontological Society Papers, 18:195-212.
Royer, D.L. and Chernoff, B. 2013. Diversity in neotropical wet forests during the Cenozoic is linked more to atmospheric CO2 than temperature. Proceedings of the Royal Society of London B 280, 20131024. http://dx.doi.org/10.1098/rspb.2013.1024.
Royer, D.L., Wilf, P., Janesko, J.A., Kowalski, E.A., and Dilcher, D.L. 2005. Correlating climate and plant ecology with leaf size and shape. potential proxies for the fossil record. American Journal of Botany, 92:1141-1151.
Sakai, A., Paton, D.M., and Wardle, P. 1981. Freezing resistance of trees of the south temperate zone, especially subalpine species of Australasia. Ecology, 62:563-570.
Schneider, J.V., Zipp, D., Gaviria, J., and Zizka, G. 2003. Successional and mature stands in an upper Andean rain forest transect of Venezuela. Do leaf characteristics of woody species differ? Journal of Tropical Ecology, 19:251-259.
Schwarzhans, W., Scofield, R.P., Tennyson, A.J.D., Worthy, J.P., and Worthy, T.H. 2012. Fish remains, mostly otoliths, from the non-marine Early Miocene of Otago, New Zealand. Acta Palaeontologica Polonica, 57:319-350.
Scriven, L.J. and Hill, R.S. 1995. Macrofossil Casuarinaceae, their identification and the oldest macrofossil record, Gymnostoma antiquum sp. nov., from the Late Paleocene of New South Wales, Australia. Australian Systematic Botany, 8:1035-1053.
Seidel, D.J., Fu, Q., Randel, W.J., and Reichler, T.J. 2008. Widening of the tropical belt in a changing climate. nature geoscience, 1:21-24.
Shackleton, N.J. and Kennett, J.P. 1975. Paleotemperature history of the Cenozoic and the initiation of Antarctic glaciation oxygen and carbon isotope analyses in DSDP Sites 277, 279, and 281. Initial Reports. DSDP, 29:743-755.
Shi, J.P. and Zhu, H. 2008. Tree species composition and diversity of tropical mountain cloud forest in the Yunnan, southwestern China. Ecological Research. DOI 10.1007/s11284-008-0484-2.
Sluiter, I.R.K., Kershaw, A.P., Holdgate, G.R., and Bulman, D. 1995. Biogeographic, ecological and stratigraphic relationships of the Miocene brown coal floras, Latrobe Valley, Victoria, Australia. International Journal of Coal Geology, 28:277-302.
Steart, D.C., Spicer, R.A., and Bamford, M.K. 2010. Is southern Africa different? An investigation of the relationship between leaf physiognomy and climate in southern African mesic vegetation. Review of Palaeobotany and Palynology, 162:607-620.
Stranks, L. and England, P. 1997. The use of a resemblance function in the measurement of climatic parameters from the physiognomy of woody dicotyledons. Palaeogeography, Palaeoclimatology, Palaeoecology, 131:15-28.
Sturman, A. and Tapper, N. 2005. Weather and Climate of Australia and New Zealand. Edition 2. Oxford, Oxford University Press.
Sutherland, R. 1995. The Australia-Pacific boundary and Cenozoic plate motions in the SW Pacific. Some constraints from Geostat data. Tectonics, 14:819-831.
Sutherland, R. 1996. Transpressional development of the Australia-Pacific boundary through southern South Island, New Zealand. Constraints from Miocene-Pliocene sediments, Waiho-1 borehole, South Westland. NZ Journal of Geology and Geophysics, 39:251-164.
Thomas, I. 1993. Late Pleistocene environments and Aboriginal settlement patterns in Tasmania. Australian Archaeology, 36:1-11.
Thompson, R.S., Anderson, K.H., Pelltier, R.T., Strickland, L.E., Bartlein, P.J., and Shafer, S.L. 2012. Quantitative estimation of climatic parameters from vegetation data in North America by the mutual climatic range technique. Quaternary Science Reviews, 51:18-39.
Tracey, J.G. 1982. The vegetation of the humid tropical region of North Queensland. Melbourne, CSIRO.
Troll, C. 1970. Das Baumfarnklima und die Verbreitung der Baumfarne auf der Erde. Tubinger Geographische Studien, 34 (Sonderband 3):179-189.
Veevers, J.J., Powell, C.M., and Roots, S.R. 1991. Review of seafloor spreading around Australia.I. Synthesis of the patterns of spreading. Australian Journal of Earth Sciences, 38:373-389.
Vella, P., Kennett, J.P., and Beu, A.G. 1975. Molluscan fossils and late Neogene paleotemperatures. New Zealand Journal of Geology and Geophysics, 18:197-202.
Verducci, M., Foresi, L.M., Scott, G.H., Sprovieri, M., Lirer, F., and Pelosi, N. 2009. The Middle Miocene climatic transition in the Southern Ocean. Evidence of paleoclimatic and hydrographic changes at Kerguelen plateau from planktonic foraminifers and stable isotopes. Palaeogeography, Palaeoclimatology, Palaeoecology, 280:371-386.
Walter, H. and Lieth, H. 1967. Klimadiagramm-Weltatlas. Jena, Gustav Fischer Verlag.
Wanntorp, L. and Wanntorp, H.-E. 2003. The biogeography of Gunnera L. vicariance and dispersal. Journal of Biogeography, 30:979-987.
Wardle, P. 1965. A comparison of alpine timber lines in New Zealand and North America. New Zealand Journal of Botany, 3:113-135.
Wardle, P. 1991. Vegetation of New Zealand. Cambridge, Cambridge University Press.
Webb, L.J. 1959. A physiognomic classification of Australian rainforests. Journal of Ecology 47:551-70.
Webb, L.J. 1968. Environmental determinants of the structural types of Australian Rain Forest Vegetation. Ecology, 49:296-311.
Whitmore, T.C. 1980. Macaranga in New Guinea and the Bismarck Archipelago. Studies in Macaranga VIII. Kew Bulletin, 34:599-606.
Wilf, P. 1997. When are leaves good thermometers? A new case for Leaf Margin Analysis. Paleobiology, 23:373-390.
Wilf P. 2009. Papuacedrus (Cupressaceae) in Eocene Patagonia. A new fossil link to Australasian rainforests. American Journal of Botany, 96:2031-2047.
Willis, J.C. 1966. A Dictionary of the Flowering Plants and Ferns. Seventh edition, revised by H. K. Airy Shaw. New York, Cambridge University Press.
Wilson, D.D. 1956. The Late Cretaceous and early Tertiary transgression in South Island, New Zealand. New Zealand Journal of Science and Technology, B 37:610-622.
Wing, S.L. and Greenwood, D.R. 1993. Fossils and fossil climate. The case for equable continental interiors in the Eocene. Philosophical Transactions Biological Sciences, 341:243-252.
Wolfe, J.A. 1971. Tertiary climatic fluctuations and methods of analysis of Tertiary floras. Palaeogeography, Palaeoclimatology, Palaeoecology, 9:27-57.
Wolfe, J.A. 1979. Temperature parameters of humid to mesic forests of eastern Asia and their relation to forests of other regions of the northern Hemisphere and Australasia. United States Geological Survey Professional Paper, 1106:1-37.
Wolfe, J.A. 1992. An analysis of present-day terrestrial lapse rates in the western conterminous United States and their significance to paleoaltitudinal estimates. United States Geological Survey Bulletin, 1964.
Wolfe, J.A. 1993. A method of obtaining climatic parameters from leaf assemblages. United States Geological Survey Bulletin, 2040:1-71.
Woodward, F. 1992. A review of the effects of climate on vegetation, ranges, competition, and composition, p. 105-123. In Peters, R.L. and Lovejoy, T.E. (eds.), Global Warming and Biological Diversity. New Haven and London, Yale University Press.
Woodward, F.I. and Williams, B.G. 1987. Climate and plant distribution at global and local scales. Vegitatio, 69:189-197.
Woodward, F., Lomas, M.R., and Kelley, C.K. 2004. Global climate and the distribution of plant biomes. Philosophical Transactions of the Royal Society, London, B 359:1465-1476.
Worthy, T.H., Jones, J., and Simpson, T. 2011. Deep Secrets. Discovering New Zealand's tropical past. New Zealand Geographic, 107:45-55.
Worthy, T.H., Tennyson, A.J.D., Jones, C., McNamara, J.A. and Douglas, B.J. 2007. Miocene waterfowl and other birds from Central Otago, New Zealand. Journal of Systematic Palaeontology, 5:1-39.
Yang, J., Spicer, R.A., Spicer, T.E.V., and Li, C.-S. 2011. 'CLAMP Online': a new web-based palaeoclimate tool and its application to the terrestrial Paleogene and Neogene of North America. Palaeobiodiversity and Palaeoenvironments, 91:10. 163-183. DOI1007/s12549-011-0056-2.
You, Y. 2010. Climate-model evaluation of the contribution of sea-surface temperature and carbon dioxide to the middle Miocene Climate Optimum as a possible analogue of future climate change. Australian Journal of Earth Sciences, 57:207-219.
You, Y., Huber, M., Müller, R.D., Poulsen, C.J., and Ribbe, J. 2009. Simulation of the Middle Miocene Climate Optimum. Geophysical Research Letters, 36:L04702, doi:10.1029/2008GL036571.
Youngson, J.H., Craw, D., Landis, C.A., and Schmitt, K.R. 1998. Redefinition and interpretation of late Miocene-Pleistocene terrestrial stratigraphy, Central Otago, New Zealand. New Zealand Journal of Geology and Geophysics, 41:51-68.
Zachos, J.C., Pagani, M., Sloan, L., Thomas, E., and Billups, K. 2001. Trends, rythyms, and aberrations in global climate 65 Ma to present. Science, 292:686-693.
Zhou, Z. and Li, H. 1994. Early Tertiary gymnosperms from Fildes Peninsula, King George Island, Antarctica, p. 208-219. In Shen, Y. (ed.), Stratigraphy and palaeontology of Fildes Peninsula, King George Island, Antarctica, Science Press, Monograph 3.
