

Article Search
Volume 27.1
January–April 2024
Full table of contents
ISSN: 1094-8074, web version;
1935-3952, print version
Recent Research Articles
See all articles in 27.1 January-April 2024
See all articles in 26.3 September-December 2023
See all articles in 26.2 May-August 2023
See all articles in 26.1 January-April 2023
 Arie W. Janssen. Naturalis Biodiversity Center, P.O. Box 9517, 2300 RA Leiden, The Netherlands. ariewjanssen@gmail.com
From 1969 to early retirement in 1997 Arie W. Janssen used to be a curator of the Palaeontology Department (Cainozoic Mollusca) of the National Museum of Geology and Mineralogy (nowadays incorporated in Naturalis Biodiversity Center) at Leiden, The Netherlands). He was responsible for the large collections, amassed substantial material from all over Europe and published many papers on molluscan fauna's, mainly on those from the North Sea Basin. In 1997 he emigrated to Malta until return to the Netherlands in 2013. From c. 1980 onward he specialized on fossil holoplanktic mollusca, concentrating on systematics and biostratigraphy on a global scale. After retirement he remained an associate researcher of the Naturalis museum until the present day. Larger papers on pteripods concern assemblages from the Dominican Republic, Jamaica, SE France (Aquitaine Basin), Italy, the eastern Mediterranean, Malta, the Philippines and Iran, frequently in cooperation with other authors. He has been managing editor of Cainozoic Research, and its predecessors, ever since 1964 until now (with interruption when living in Malta).

 Jocelyn A. Sessa. Division of Paleontology, American Museum of Natural History, New York, NY, USA jsessa@amnh.org
Jocelyn A. Sessa is a paleobiologist at the American Museum of Natural History in New York City. Her research melds fossil and modern data to elucidate the response of mollusks to environmental stresses, such as climatic shifts and mass extinction events, across both space and time. She received her PhD in 2009 from Pennsylvania State University, and was a postdoctoral fellow in the Paleobiology Department of the Smithsonian National Museum of Natural History before arriving at AMNH in 2012. Mollusks are the primary focus of her research because they are well preserved and abundant in fossil and modern assemblages (and quite beautiful!). Additionally, the chemistry of mollusk shells records seasonal temperature variations, which she uses to reconstruct past climates. Jocelyn has tracked the response of mollusks to the Cretaceous-Paleogene mass extinction, to the Paleocene-Eocene Thermal Maximum, one of the best geological examples of a rapid global warming event, and to the evolution of oceanographic parameters in the Pleistocene.
 Ellen Thomas. Department of Geology and Geophysics, Yale University, New Haven CT, USA, and Department of Earth and Environmental Sciences, Wesleyan University, Middletown, CT, USA ellen.thomas@yale.edu
Ellen Thomas is a micropaleontologist/paleoeanographer whose research is focused on benthic foraminifera, combining assemblage studies with trace element and stable isotope analysis. She was educated at the University of Utrecht (Netherlands), moving to the US after finishing her PhD in 1979, where she presently is employed at Yale University and Wesleyan University (Connecticut). Most of her research is based on material provided by the International Ocean Discovery Program (and its predecessors), from the Late Cretaceous through Recent, but she also studies salt marsh and estuarine foraminifera from the last few millennia. She was involved in the discovery and documentation of the Paleocene Eocene Thermal Maximum and other hyperthermal events, specifically the effect of these events on marine biota, for which she received the Maurice Ewing medal from AGU (2013). She is the 2016 Brady medal recipient. She has been editor of Marine Micropaleontology and Geology, and is presently Editor in Chief of Paleoceanography.
FIGURE 1. Map of the northeastern coast of the USA, showing part of the northern portion of the Atlantic Coastal Plain and the location of the studied cores: BR = Bass River; C = Clayton; WL = Wilson Lake; CD = Cambridge-Dorchester; MCBR = Mattawoman Creek-Billingsley Road. The New Jersey Coastal Plain is the northern section of the Salisbury Embayment. In outcrop, the Fall Line marks the change from Precambrian and Paleozoic rocks of the Piedmont province in the west to the relatively undeformed, slightly dipping Mesozoic and Cenozoic sediments of the Coastal Plain in the east (Gibson and Bybell, 1994). For visual ease, the New Jersey Coastal Plain and the Salisbury Embayment labels are delineated offshore.
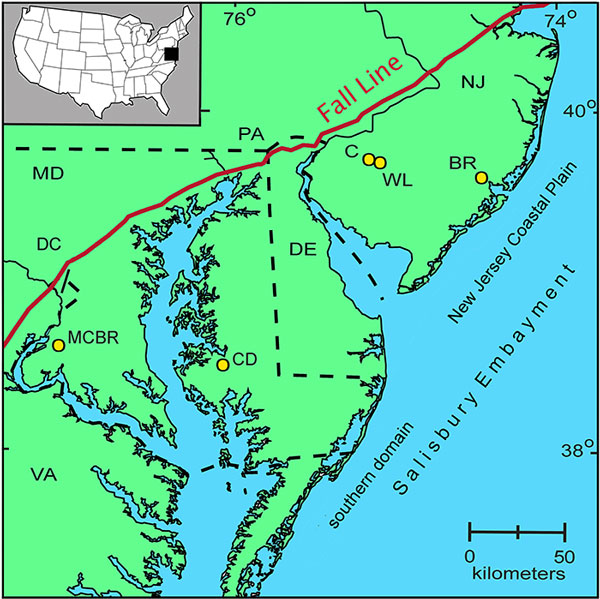
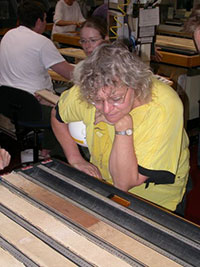
FIGURE 2. Specimen storage in the Naturalis (Leiden, NL) fossil holoplanktic mollusk collection.
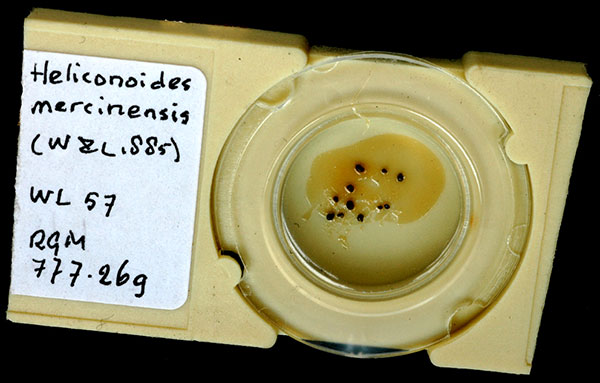
FIGURE 3. Altaspiratella elongatoidea (Aldrich, 1887). 1, Wilson Lake section, sample 31, depth 100.89-100.95 m, RGM 777 230; apertural view. 2, Clayton section, sample 9, depth 91.44-91.4 m; RGM 777 308a; apertural view. 3-4, Wilson Lake section, sample 42, depth 104.24-104.30 m; RGM 777 251a, 3: apertural view, 4: apical view.
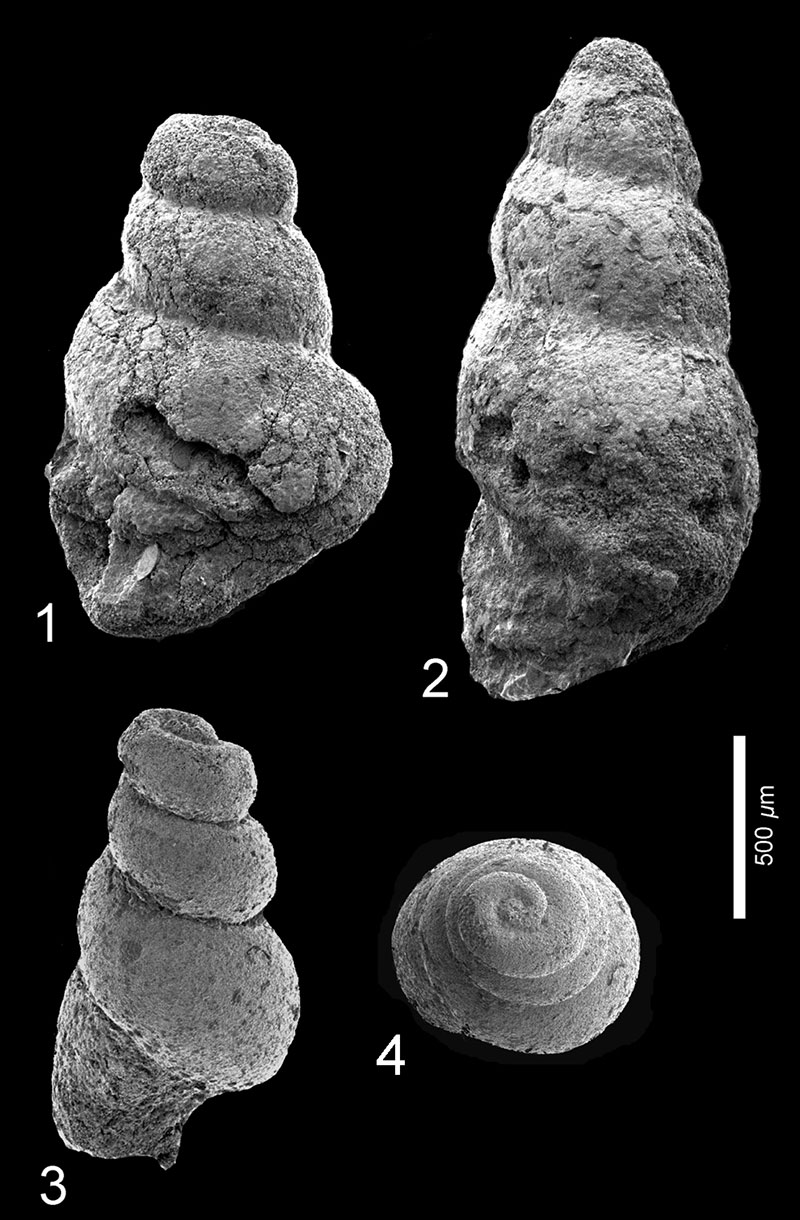
FIGURE 4. Altaspiratella elongatoidea (Aldrich, 1887). Computed tomography (CT) scan of the specimen pictured in Figure 3.3-4, resolution 1.6 micrometer/voxel, 165 kV, detector exposure timing 750 ms. For the interactive version, download the PDF to your hard drive or desktop and open in Acrobat or enable the 3D option in Acrobat in your Internet browser. By clicking on the image, the interactive 3D model is activated, and the reader can use the mouse to rotate the specimen and change magnification.
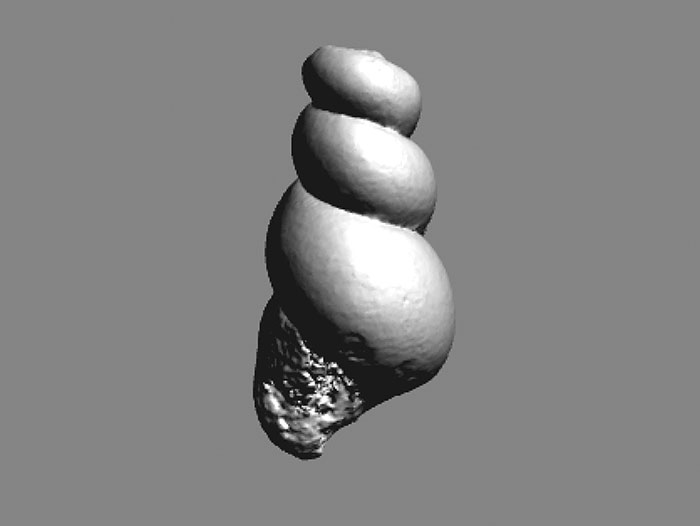
FIGURE 5. Heliconoides mercinensis (Watelet and Lefèvre, 1885). 1-3, Wilson Lake section, sample 27, depth 99.67-99.73 m, RGM 777 223a; 1: apical view, 2: apertural view, 3: umbilical view.
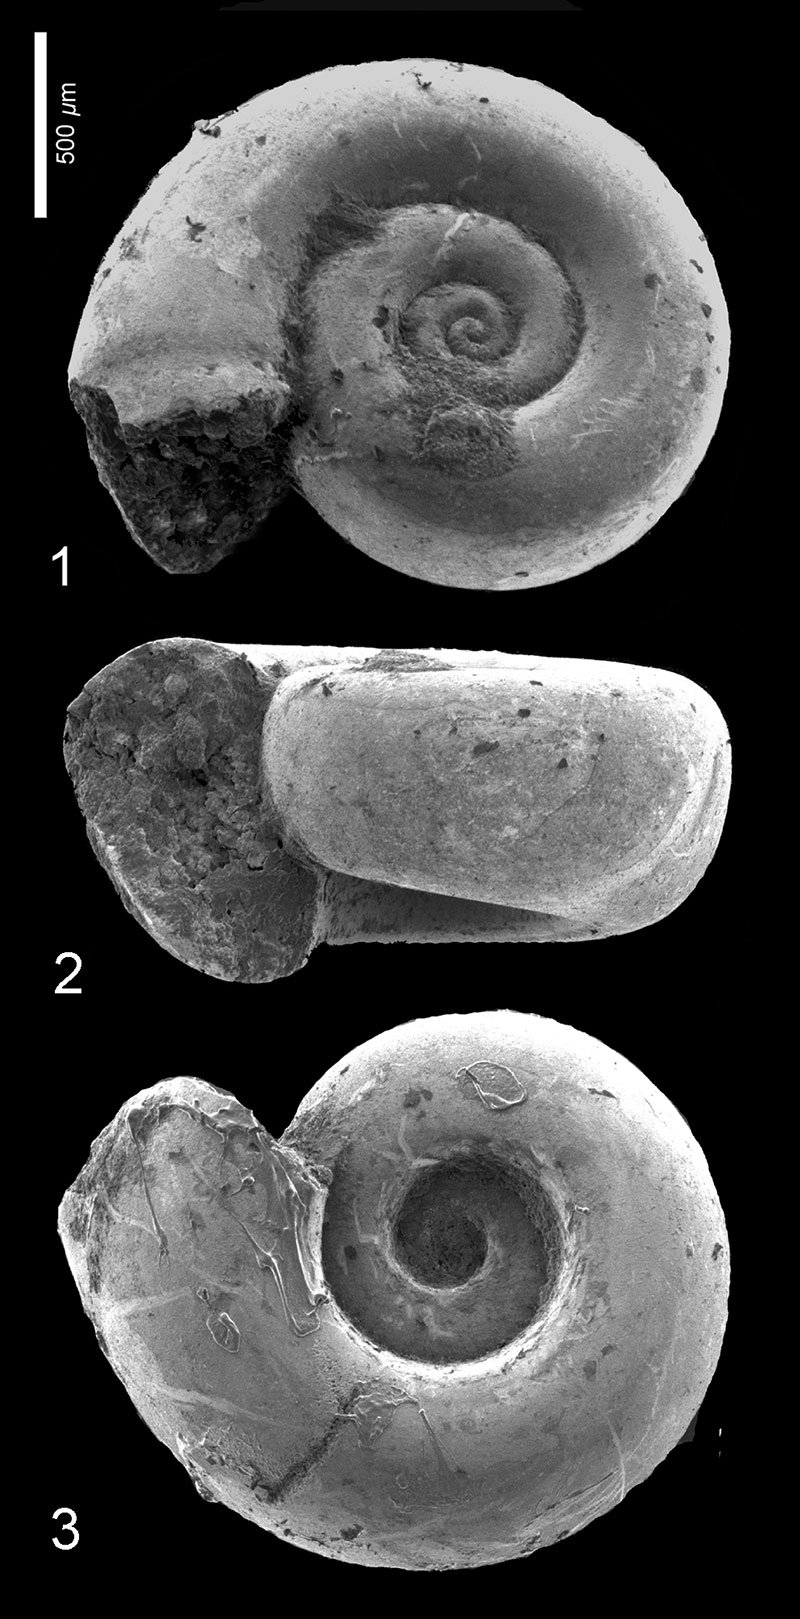
FIGURE 6. Heliconoides mercinensis (Watelet and Lefèvre, 1885). Computed tomography (CT) scan of the specimen pictured in Figure 5.1-3. Resolution 1.9 micrometer/voxel, 165 kV, detector exposure timing 750 ms. For the interactive version, download the PDF to your hard drive or desktop and open in Acrobat or enable the 3D option in Acrobat in your Internet browser. By clicking on the image, the interactive 3D model is activated, and the reader can use the mouse to rotate the specimen and change magnification.
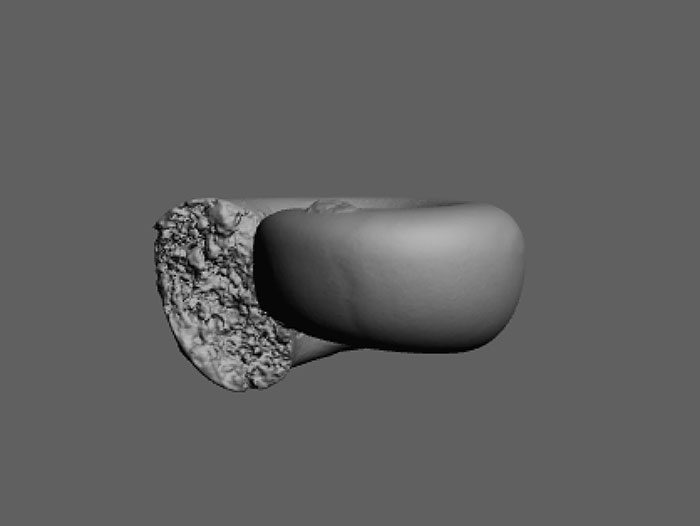
FIGURE 7. Limacina aegis Hodgkinson in Hodgkinson, Garvie and Bé, 1992. 1, Clayton section, sample 19, depth 94.55-94.58 m, RGM 777319a; apertural view. 2, Clayton section, sample 21, depth 95.07-95.10 m, RGM 777 323; apertural view. 3-4, Wilson Lake section, sample 34, depth 101.80-101.86 m, RGM 777 236a; 3: apical view, 4: apertural view. 5-6, Wilson Lake section, sample 52, depth 07.08-107.11 m, RGM 777 264a; 5: apertural view, 6: umbilical view. 7-9, Wilson Lake section, sample 63, depth 108.20-108.26 m, RGM 777 283 (specimen lost); 7: apical view, 8: apertural view; 9: umbilical view. 10-11, Cambridge-Dorchester section, sample 15, depth 220.22-220.28 m, RGM 777 338; 10: apical view, 11: apertural view.
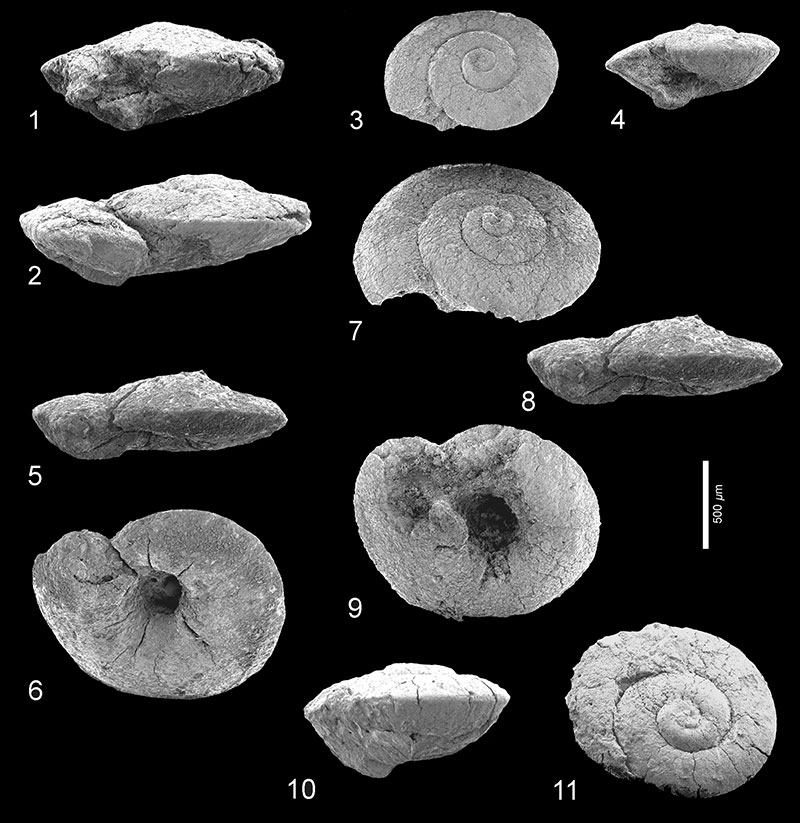
FIGURE 8. Limacina aegis Hodgkinson in Hodgkinson, Garvie and Bé, 1992. Computed tomography (CT) scan of specimen RGM 777.264b, which has the same locality data as the specimen in Figure 7.5-6. Resolution 2.0 micrometer/voxel, 165 kV, detector exposure timing 750 ms. For the interactive version, download the PDF to your hard drive or desktop and open in Acrobat or enable the 3D option in Acrobat in your Internet browser. By clicking on the image, the interactive 3D model is activated, and the reader can use the mouse to rotate the specimen and change magnification.
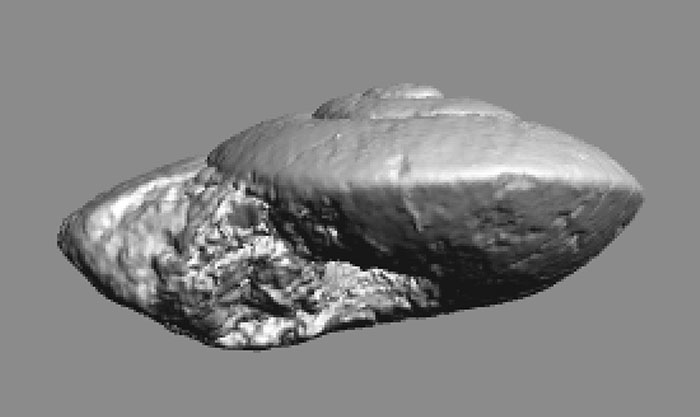
FIGURE 9. Limacina novacaesarea Janssen and Sessa sp. nov. 1-3, Holotype, Wilson Lake section, sample 24, depth 98.76-98.82 m, RGM 777 219; 1: apical; view, 2: apertural view, 3: umbilical view. 4-6, Paratype 1, Wilson Lake section, sample 22. Depth 98.15-98.21 m, RGM 777 215a; 4: apical view, 5: apertural strongParatype 2, Wilson Lake section, sample 27, depth 99.67-99.73 m, RGM 777 225; apertural view of poorly preserved, slightly depressed specimen.
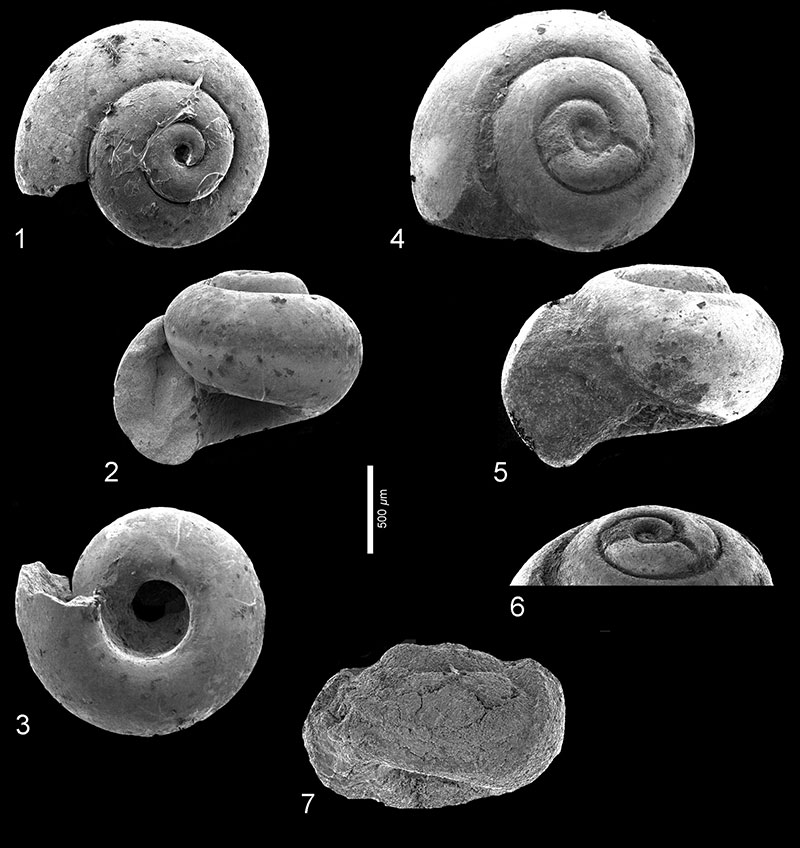
FIGURE 10. Limacina novacaesarea Janssen and Sessa sp. nov. Computed tomography (CT) scan of the specimen pictured in Figure 9.1-3. Resolution 4.0 micrometer/voxel, 185 kV, detector exposure timing 750 ms. For the interactive version, download the PDF to your hard drive or desktop and open in Acrobat or enable the 3D option in Acrobat in your Internet browser. By clicking on the image, the interactive 3D model is activated, and the reader can use the mouse to rotate the specimen and change magnification.
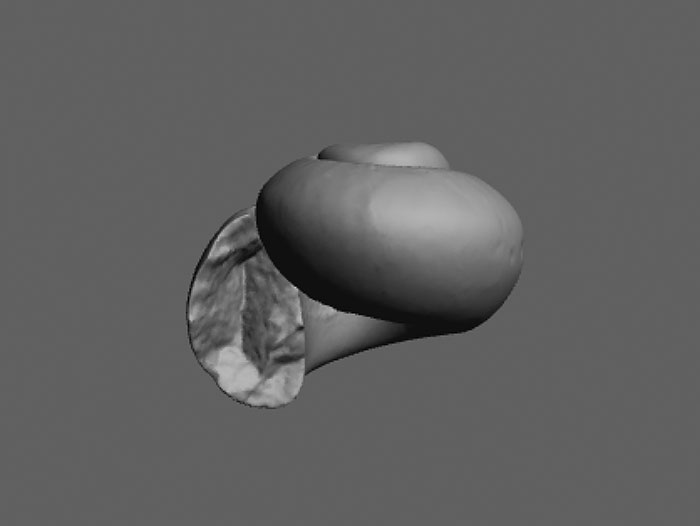
FIGURE 11. Limacina sp. 1. 1-3, Wilson Lake section, sample 37, depth 102.72-102.78 m, RGM 777 241; 1: apical view, 2: apertural view, 3: umbilical view. 4-5, Wilson Lake section, sample 50, depth 106.68-106.74 m, RGM 777259a; 4: apical view, 5: apertural view. 6, Wilson Lake section, sample 40, depth 103.02-103.08 m, RGM 777248; apical view.
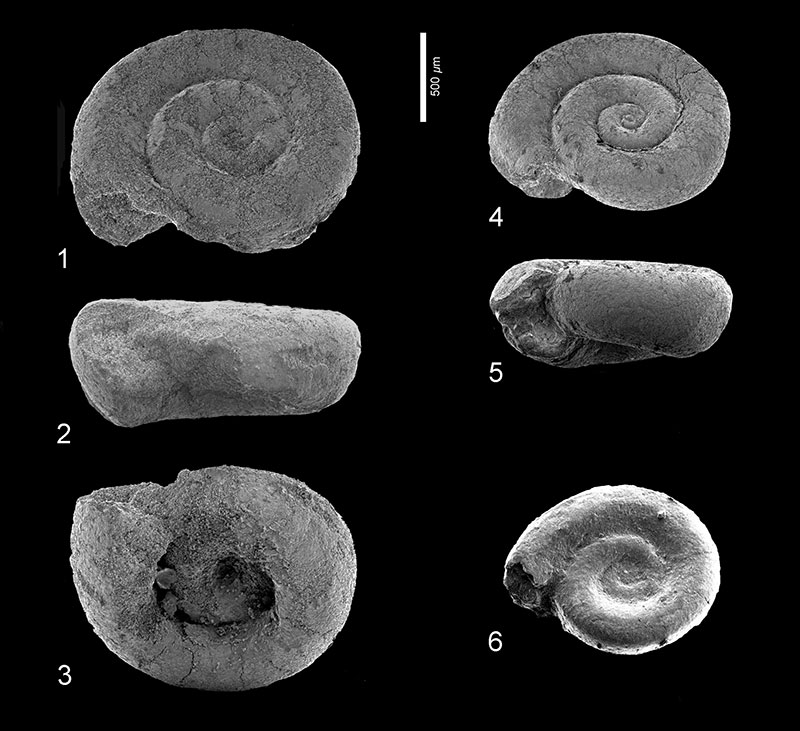
FIGURE 12. Limacina sp. 1. Computed tomography (CT) scan of the specimen pictured in Figure 11.1-3. Resolution 4.9 micrometer/voxel, 145 kV, detector exposure timing 750 ms. For the interactive version, download the PDF to your hard drive or desktop and open in Acrobat or enable the 3D option in Acrobat in your Internet browser. By clicking on the image, the interactive 3D model is activated, and the reader can use the mouse to rotate the specimen and change magnification.
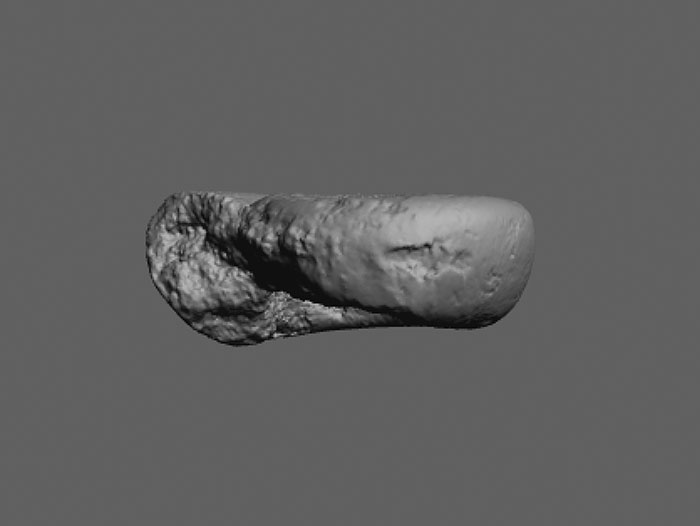
FIGURE 13. Limacina sp. 2. 1-2, Cambridge-Dorchester section, sample 26, depth 222.61-222.62 m, RGM 777 345; 1 : apical view, 2: apertural view.
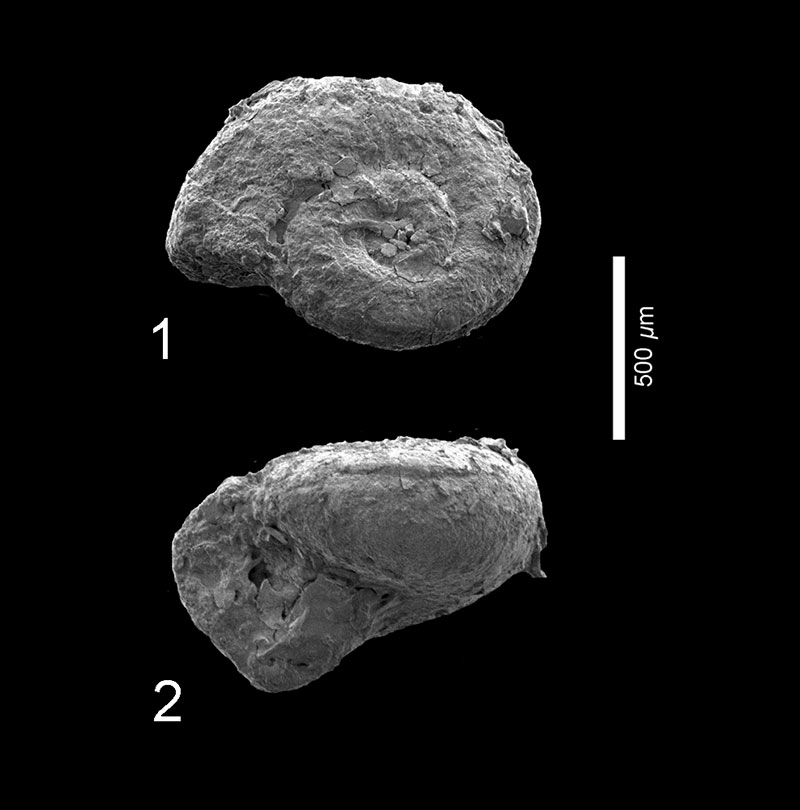
FIGURE 14. Stratigraphy and lithology for the Bass River core, after Stassen et al., 2015. The number of pteropods recognized (red) is compared to the B/Ca values (purple) in the planktonic foraminiferal genus Acarinina, a surface-water (mixed layer) dweller (Babila et al., 2016), and with δ13C values of bulk carbonate (orange), indicating the location of the carbon isotope excursion (Stassen et al., 2015). The change in B/Ca is interpreted as reflecting a decline in pH by ~0.3-0.4 pH units (Babila et al., 2016). The irregularity of pteropod distribution is likely because they were transported to these sites, and do not represent an in situ population.
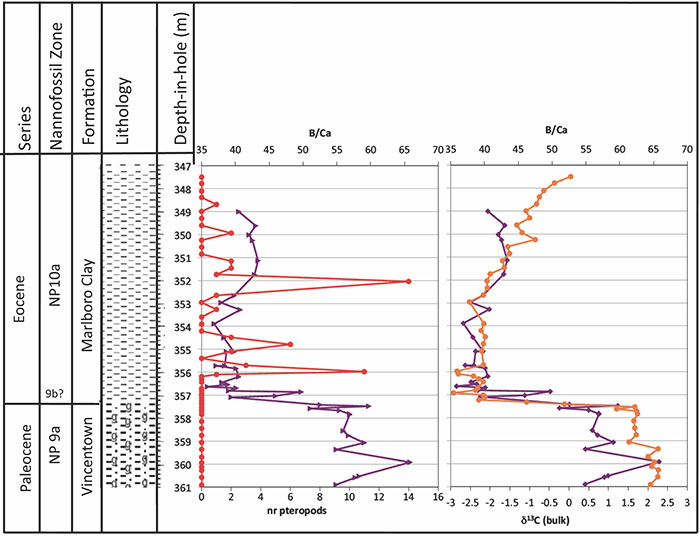
TABLE 1. Distribution of pteropod species in the Wilson Lake section.
| Sample number |
Sample depth (m) |
Age after CIE onset (ky) |
Altaspiratella elongatoidea |
Heliconoides mercinensis |
Limacina aegis |
Limacina novacaesarea |
Limacina sp.1 | Nannoplankton zone |
| 19 | 97.23- 97.29 | 66.58 | - | 1 | - | - | - | NP10a |
| 20 | 97.54- 97.60 | 65.20 | 1 | 7 | - | - | - | |
| 21 | 97.84- 97.90 | 63.81 | 1 | 3 | - | - | - | |
| 22 | 98.15- 98.21 | 62.43 | 2 | 2 | - | 2 | - | |
| 23 | 98.45- 98.51 | 61.05 | - | 1 | - | - | - | |
| 24 | 98.76- 98.82 | 59.14 | - | 3 | 1 | 1 | - | |
| 25 | 99.06- 99.12 | 58.28 | - | 6 | - | - | - | |
| 26 | 99.36-899.43 | 56.90 | 1 | 3 | - | - | - | |
| 27 | 99.67- 99.73 | 55.51 | - | 8 | 1 | 1 | - | |
| 28 | 99.97-100.04 | 54.13 | - | 1 | 1 | - | - | |
| 29 | 100.28-100.34 | 52.74 | - | 4 | - | - | - | |
| 30 | 100.58-100.64 | 51.36 | - | 7 | - | - | - | |
| 31 | 100.89-100.95 | 49.98 | 1 | 6 | - | - | - | |
| 32 | 101.19-101.25 | 48.57 | - | 4 | - | - | - | |
| 33 | 101.50-101.56 | 47.21 | - | 6 | - | - | - | |
| 34 | 101.80-101.86 | 45.83 | 1 | 15 | 1 | - | - | |
| 36 | 102.41- 102.47 | 43.06 | - | 1 | 1 | - | - | |
| 37 | 102.72-102.78 | 41.68 | 1 | 2 | - | - | 1 | |
| 39 | 103.33-103.37 | 38.91 | 1 | 8 | 1 | - | 1 | |
| 40 | 103.63-103.69 | 37.51 | - | 5 | 1 | - | 1 | |
| 41 | 103.94-104.00 | 35.70 | 3 | 1 | - | - | - | |
| 42 | 104.24-104.30 | 33.89 | 3 | 1 | - | - | - | |
| 43 | 104.55-104.61 | 32.09 | - | 3 | - | - | - | |
| 45 | 105.16-105.22 | 28.47 | - | 3 | - | - | - | |
| 48 | 106.07-106.13 | 23.05 | - | 2 | - | - | - | |
| 49 | 106.38-106.44 | 21.25 | 1 | 11 | - | - | - | NP9 |
| 50 | 106.68-106.74 | 19.43 | 2 | 13 | 1? | - | - | |
| 51 | 106.98-107.05 | 17.63 | 1 | 13 | 1 | - | - | |
| 52 | 107.08-107.11 | 17.18 | - | - | 12 | - | - | |
| 53 | 107.17-107.20 | 15.83 | 1 | - | 1 | - | - | |
| 54 | 107.29-107.35 | 17.18 | - | 4 | - | - | - | |
| 56 | 107.47-107.50 | 14.76 | - | 1 | - | - | - | |
| 57 | 107.59-107.66 | 14.02 | - | 11 | 1 | - | - | |
| 58 | 107.69-107.72 | 13.57 | 2 | 3 | 1 | - | - | |
| 59 | 107.78-107.81 | 13.03 | - | 5 | 9 | - | - | |
| 60 | 107.90-107.96 | 12.21 | - | 4 | 2 | - | - | |
| 61 | 107.99-108.02 | 11.76 | 2 | 1 | - | - | - | |
| 62 | 108.08-108.11 | 11.22 | - | 2 | - | - | - | |
| 63 | 108.20-108.26 | 10.41 | 3 | 12 | 2 | - | 1 | |
| 65 | 108.39-108.42 | 9.41 | - | 7 | - | - | - | |
| 67 | 108.60-108.63 | 8.15 | - | 1 | - | - | - | |
| 68 | 108.69-108.72 | 7.61 | 1 | 3 | 3 | - | - |
TABLE 2. Distribution of pteropod species in the Bass River section.
| Sample number | Sample depth (m) |
Age after CIE onset (ky) | Altaspiratella elongatoidea | Heliconoides mercinensis | Limacina aegis | Limacina novacaesarea | Limacina sp.1 | Nannoplankton zone |
| 9 | 349.94-349.97 | 87.85 | - | 2 | - | - | - | NP10a |
| 13 | 351.16-351.19 | 80.76 | 1 | 1 | - | - | - | |
| 14 | 351.46-351.50 | 78.99 | - | 1 | - | - | - | |
| 16 | 352.04-352.07 | 75.62 | 1 | 7 | 3 | - | - | |
| 18 | 352.65-352.68 | 72.07 | - | - | - | 1? | - | |
| 20 | 353.26-353.29 | 67.05 | - | 1? | - | - | - | |
| 24 | 354.48-354.51 | 54.97 | 1 | - | - | - | - | |
| 25 | 354.79-354.82 | 52.03 | 3 | 2 | 1 | - | - | |
| 26 | 355.09-355.12 | 49.08 | 1 | - | 1 | - | - | |
| 28 | 355.70-355.73 | 43.34 | - | 3 | - | - | - | |
| 29 | 355.98-356.01 | 40.27 | - | 9 | - | - | - | |
| 30 | 356.10-356.13 | 39.37 | - | - | 1? | - | - |
TABLE 3. Distribution of pteropod species in the Clayton section.
| Sample number |
Sample depth (m) |
Age after CIE onset (ky) |
Altaspiratella elongatoidea |
Heliconoides mercinensis |
Limacina aegis |
Limacina novacaesarea |
Limacina sp. 1 | Nannoplankton zone |
| 9 | 91.44-91.47 | 37.51 | 4 | 5 | 2 | - | 1 | NP10a |
| 10 | 91.74-91.78 | 35.71 | - | - | 1 | - | - | |
| 11 | 92.05-92.08 | 33.90 | - | 6 | - | - | - | |
| 12 | 92.35-92.38 | 32.10 | 1 | - | - | - | - | |
| 14 | 92.96-92.99 | 28.49 | - | - | - | 1 | - | |
| 15 | 93.27-93.30 | 26.69 | - | - | - | - | - | |
| 17 | 94.03-94.06 | 22.18 | - | - | 4 | - | - | NP9b |
| 18 | 94.21-94.24 | 21.10 | - | 1 | 2 | - | - | |
| 19 | 94.55-94.58 | 19.12 | - | 3 | 4 | - | - | |
| 20 | 94.79-94.82 | 17.67 | 1 | 1 | 1 | - | - | |
| 21 | 95.07-95.10 | 16.05 | - | - | 1 | - | - | |
| 22 | 95.40-95.43 | 14.07 | 3 | 4 | 2 | - | - |
TABLE 4. Distribution of pteropod species in the Cambridge-Dorchester section.
| Sample number | Sample depth (m) | Altaspiratella longatoidea |
Heliconoides mercinensis |
Limacina aegis | Limacina sp. 1 | Limacina sp. 2 |
| 8 | 214.01-214,03 | 1 | 3 | 1 | - | - |
| 10 | 215.80-215,83 | - | 3 | - | - | - |
| 12 | 217.41-217.44 | - | 1 | 1 | - | - |
| 13 | 218.50-218.51 | - | 1? | - | - | - |
| 14 | 219.30-219.33 | 1 | 4 | - | - | - |
| 15 | 220.22-220.28 | 3 | 6 | 1 | - | - |
| 16 | 221.19-221.21 | 1 | - | - | - | - |
| 17 | 221.47-221.48 | 1 | 5 | 1 | 2 | - |
| 23 | 222.09-222.14 | - | - | - | 1 | - |
| 26 | 222.61-222.62 | - | - | - | - | 1 |
| 33 | 223.60-223.61 | - | - | - | - | - |
TABLE 5. Distribution of Heliconoides mercinensis in the Mattawoman Creek-Billingsley Road core 2 section.
| Sample number | Sample depth (m) |
Heliconoides mercinensis |
| 14 | 5.15-5.20 | 1? |
| 20 | 5.74-5.80 | 2 |
| 28 | 6.55-6.60 | 1 |
| 29 | 6.65-6.70 | 1 |
| 41 | 7.85-7.90 | 3? |
| 49 | 8.65-8.70 | 2 |
| 64 | 10.15-10.20 | 1? |
| 72 | 10.94-11.00 | 1? |
| 84 | 12.17-12.22 | |
| 85 | 12.27-12.32 | 4, 1? |
Pteropoda (Mollusca, Gastropoda, Thecosomata)from the Paleocene-Eocene Thermal Maximum (United States Atlantic Coastal Plain)
Plain Language Abstract
Approximately 56 million years ago, the Earth underwent geologically rapid global warming by ~5-8° C, during an event called Paleocene-Eocene Thermal Maximum (PETM). The response of many marine and terrestrial plants, animals, and microorganisms to the PETM has been well documented, but marine mollusks (clams, snails, and relatives) are an exception. Here, we describe the first known assemblage from the PETM of pteropods (commonly known as "sea butterflies"), snails that have evolved to swim, spending their entire lives in the water column. We find six species of pteropods, one of which is new, whereas previously only one species was known from the earliest Eocene and older. Pteropods have thin shells that are not easily preserved, so rapid burial, triggered by increased sediment supply due to high rainfall, may have created the conditions that allowed the pteropods to be preserved. Potential ancestors, however, have never been found anywhere, so we suggest instead that the PETM may have triggered diversification in pteropods.
Resumen en Español
Pteropoda (Mollusca, Gastropoda, Thecosomata) del Máximo Térmico Paleoceno-Eoceno (Llanura Costera del Atlántico de Estados Unidos)
La respuesta de muchos organismos al Máximo Térmico del Paleoceno-Eoceno (MTPE; ~56 Ma) ha sido documentada, pero no se conocen moluscos marinos de depósitos de esa edad. Describimos por primera vez una asociación MTPE de pterópodos (moluscos planctónicos) consistente de seis especies representando tres géneros (Altaspiratella, Heliconoides y Limacina). Cuatro especies pudieron identificarse a nivel de especie y una de éstas, Limacina novacaesarea sp. nov., se describe como nueva. Solamente el género Heliconoides se conocía previamente de sedimentos pre-eocenos, con un único espécimen campaniano y una especie del Paleoceno más tardío. Recuperamos pterópodos de Marlboro Clay (Llanura Costera del Atlántico de Estados Unidos), correspondiente a paleoprofundidades de plataforma interna (parte sur del engolfamiento de Salisbury) a media-externa (Llanura Costera de Nueva Jersey). La mayoría de las asociaciones de pterópodos actuales habitan profundidades de 200 m o más, por lo que su ocurrencia a profundidades de plataforma puede reflejar transporte desde aguas más abiertas. Durante el MTPE, el pH en las aguas más superficiales del océano puede haber declinado, pero esto no causó disolución de los pterópodos antes de que llegasen al fondo marino, posiblemente debido a un efecto buffer en aguas costeras. La aparición aparentemente repentina de tres géneros podría reflejar una mejor preservación debido a altas tasas de sedimentación, dado que las formaciones infra- y suprayacentes muestran una pobre preservación de microfósiles calcáreos. Sin embargo, no se han encontrado potenciales ancestros en ningún lado, por lo que consideramos que es más probable que los cambios ambientales rápidos durante el MTPE, tales como de temperatura, escorrentía y flujos de nutrientes, y la química oceánica, pueden haber disparado la diversificación de los pterópodos.
Palabras clave: PETM; Ypresiano; Llanura Costera de Nueva Jersey; Pteropoda; especie nueva
Traducción: Diana Elizabeth Fernández
Résumé en Français
text
Translator: Kenny J. Travouillon or Antoine Souron
Deutsche Zusammenfassung
Pteropoda (Mollusca, Gastropoda, Thecosomata) aus dem Paläozän/Eozän-Temperaturmaximum (Atlantische Küstenebene der Vereinigten Staaten)
Die Reaktionen vieler Organismen auf das Paläozän/Eozän-Temperaturmaximum (PETM; ~56 Ma) wurde dokumentiert, doch marine Mollusken aus dieser Zeit nicht bekannt. Wir beschreiben zum ersten Mal eine PETM-Assemblage von Preopoden (planktischen Mollusken), die aus sechs Arten und drei Gattungen (Altaspiratella, Heliconoides und Limacina) besteht. Vier Arten konnten auf das Artniveau bestimmt werden und eine davon, Limacina novacaesarea sp. nov., ist als neue Art beschrieben. Bis jetzt war nur die Gattung Heliconoides mit einem Stück aus dem Campanium und einer spätpaläozänen Art aus prä-eozänen Sedimenten bekannt. Wir entdeckten Pteropoden aus dem Marlboro-Ton (Atlantische Küstenebene der Vereinigten Staaten), abgelagert in Paläotiefen vom inneren Schelf (Südliche Salisbury-Bucht) bis zum mittleren-äußeren Schelf (New Jersey Küstenebene). Die meisten lebenden Pteropoden-Assemblagen kommen in Wassertiefen von 200m oder mehr vor, so dass ihre Existenz auf dem Schelf einen Transport aus offeneren Gewässern nahelegt. Während des PETM ging der PH-Wert in der oberen Wassersäule möglicherweise zurück, was jedoch nicht der Grund für die Auflösung der Pteropoden vor Erreichen des Meeresbodens war, möglicherweise wegen einer Pufferfunktion in den Küstengewässern. Das offensichtlich plötzliche Auftreten von drei Gattungen reflektiert möglicherweise eine bessere Erhaltung aufgrund von hohen Sedimentationsraten, da die darunter-und darüber liegenden Formationen schlechte Erhaltungszustände kalzitischer Mikrofossilien zeigen. Potentielle Vorfahren wurden jedoch nirgendwo gefunden, daher halten wir es für wahrscheinlicher, dass die schnellen Umweltveränderungen während des PETM, wie Temperatur, Nährstofffluß und Meerwasserchemie, der Auslöser für die Pteropoden-Diversifikation gewesen sein könnte.
Schlüsselwörter: PETM; Ypresium; New Jersey Küstenebene; Pteropoda; neue Art
Translator: Eva Gebauer
Arabic
Translator: Ashraf M.T. Elewa
-
-
-
Review: The Princeton Field Guide to Mesozoic Sea Reptiles
 The Princeton Field Guide to Mesozoic Sea Reptiles
Article number: 26.1.1R
April 2023
 Poster Winners 2024